A Deep Dive into Jenkins Folders: Best Practices for Project Organization.
Overview.
The “Folders Concept in Jenkins” refers to the organizational feature in Jenkins that allows users to categorize and group jobs and pipelines into folders. This feature helps streamline and manage Jenkins jobs, especially in large-scale environments where there are many projects and pipelines.

Why Use Folders in Jenkins?
- Improved Organization: With multiple teams and projects, folders allow each team to manage its own set of jobs and pipelines without interference from others.
- Simplified Access Control: Jenkins folders support finer access control, enabling permissions for each folder and its contents, helping maintain security and proper access across teams.
- Scalability: As the number of Jenkins jobs increases, folders provide an easy way to scale without losing control over the job structure.
- Better Job Management: It simplifies job management by organizing them based on different criteria, such as project type, team, environment, etc.
STEP 1: Go to jenkins dashboard.
- Click create on new job.
- Enter Myjob.
- Select freestyle project and click ok.
- Click on save.
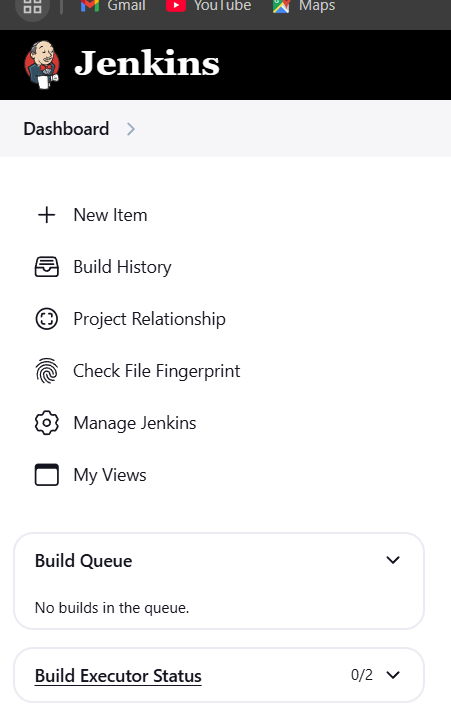
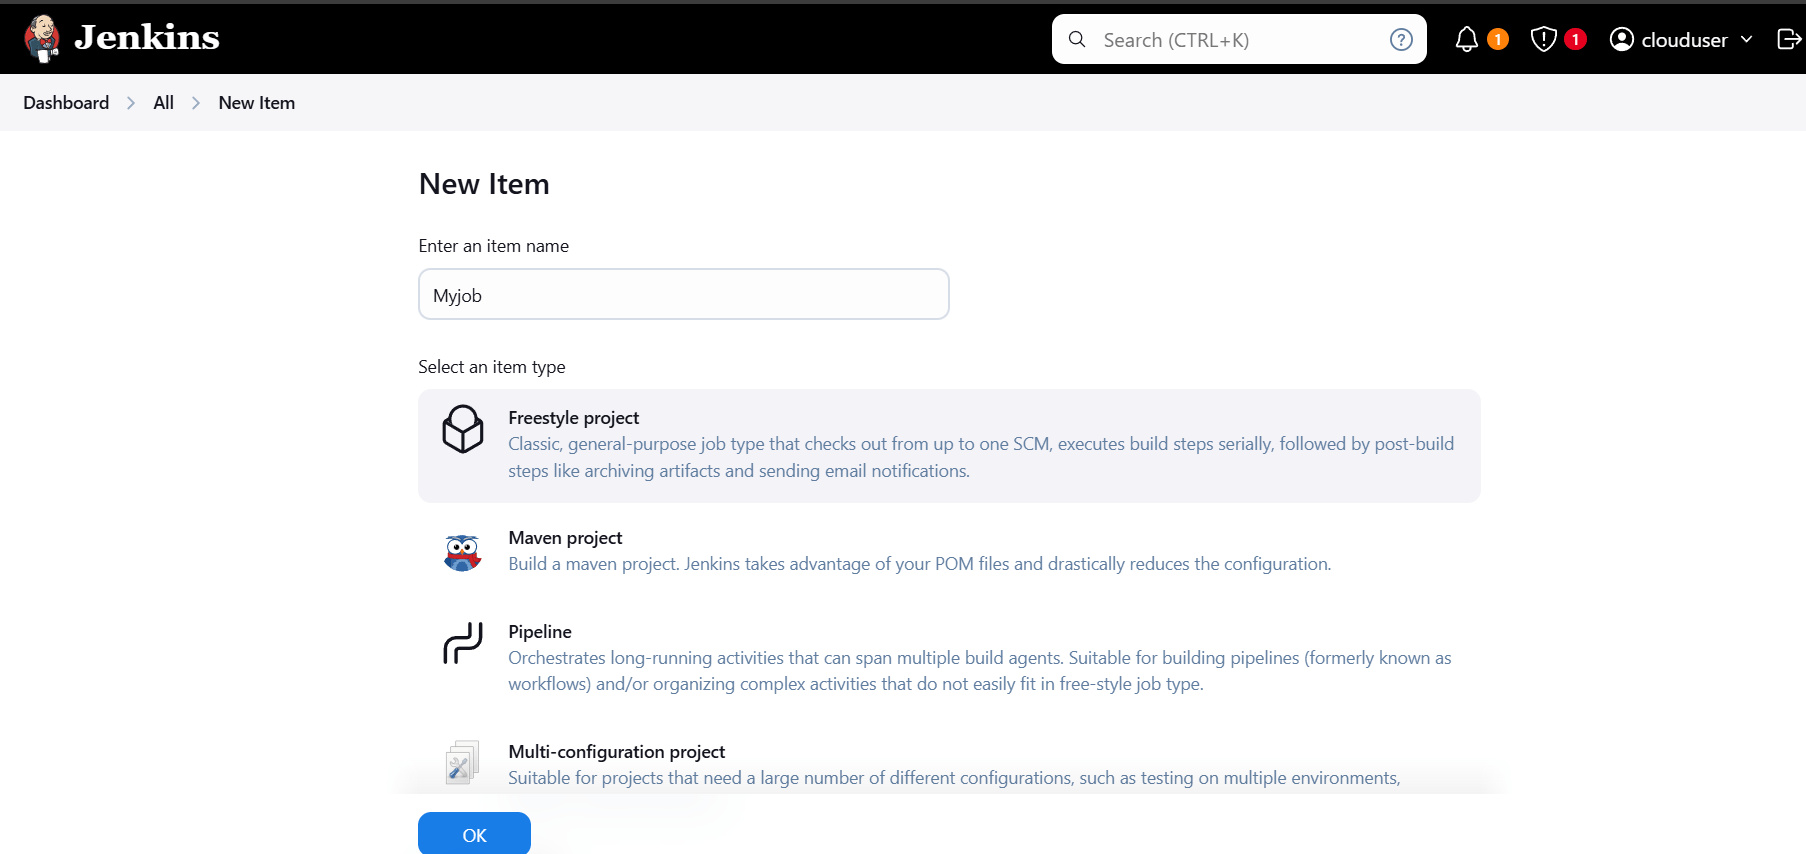
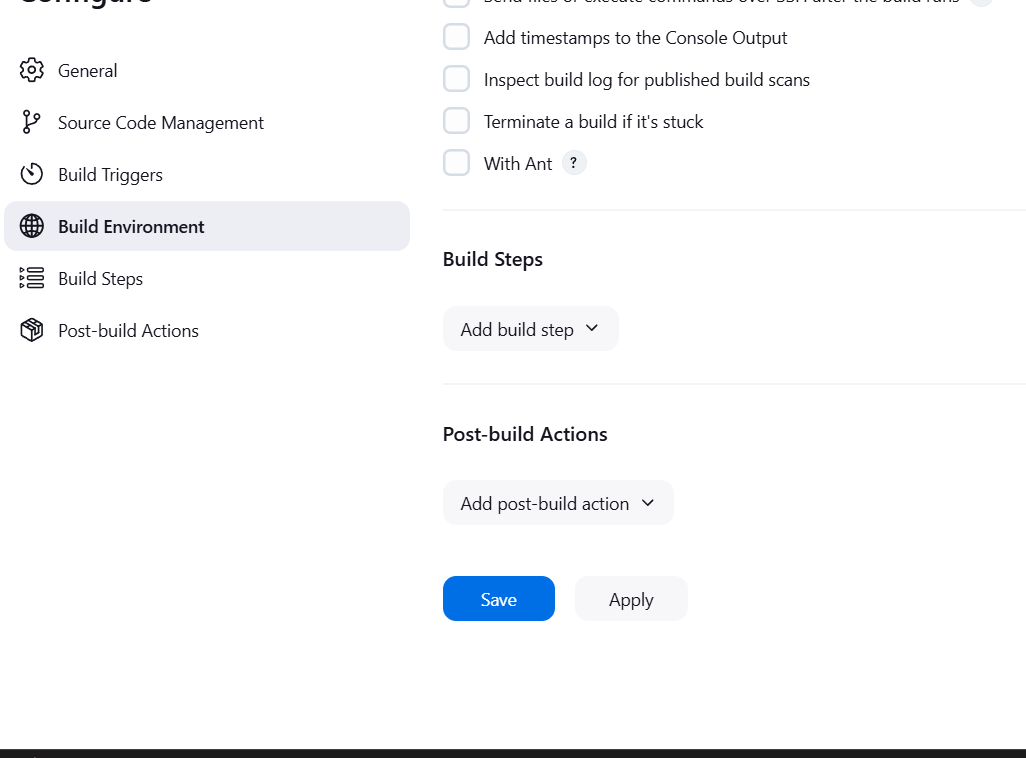
STEP 2: Create new item.
- Enter the name Firstfolder.
- Select folder and click on ok button.
- Save it.
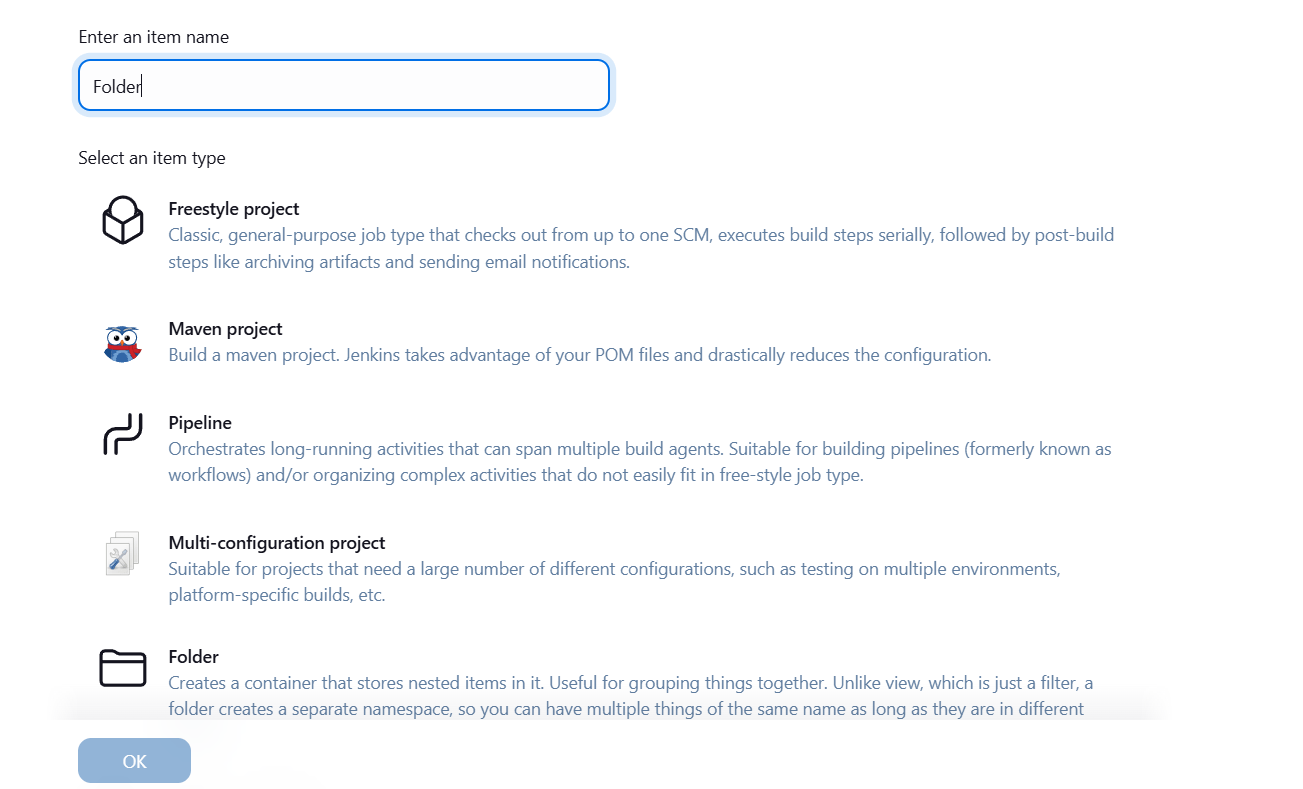
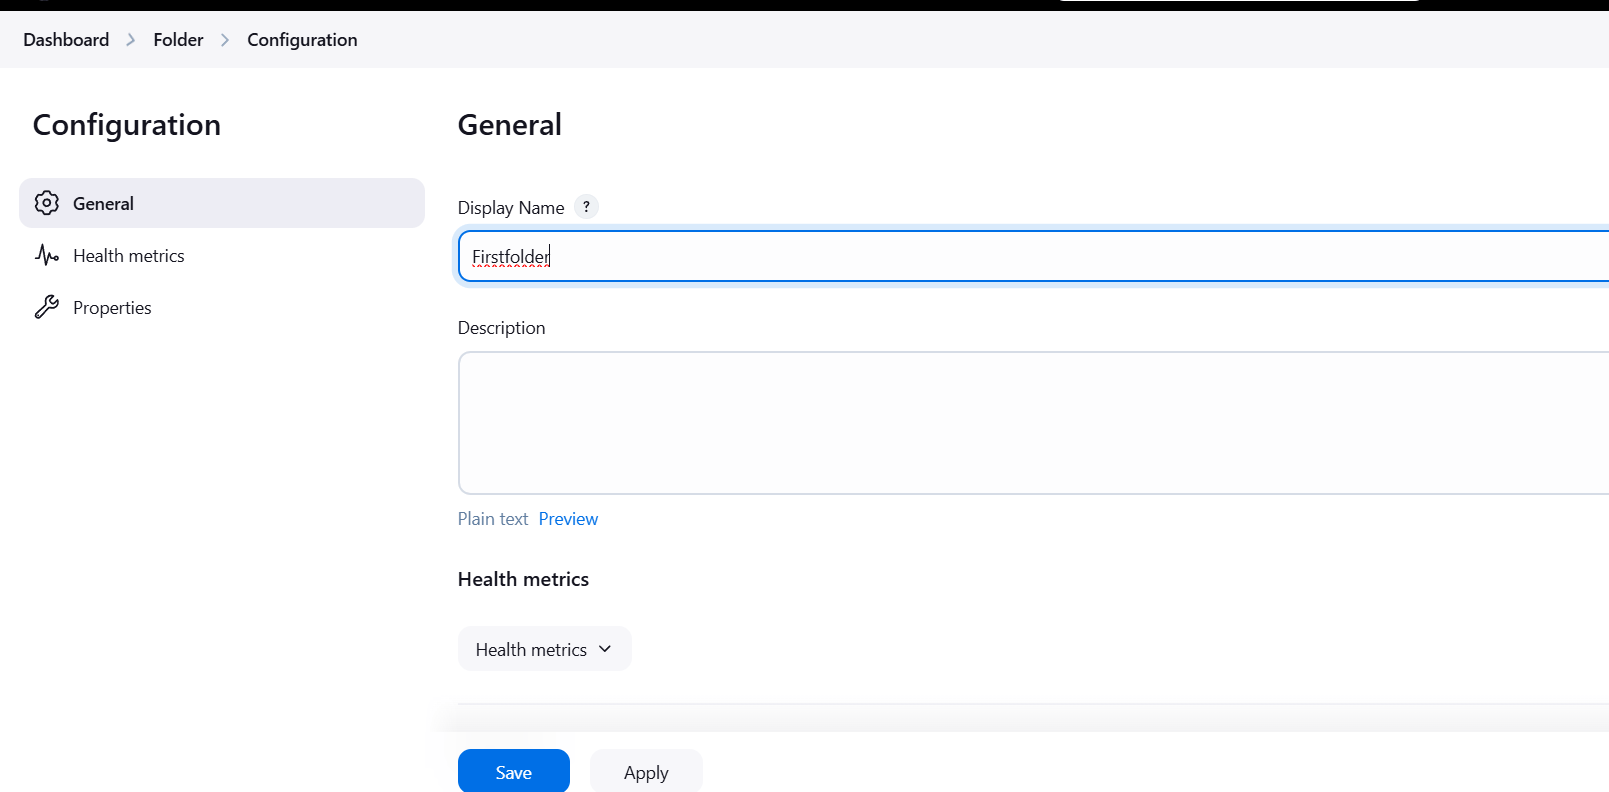
STEP 3: Create new item.
- Enter folder name Folder 2.
- Select folder and click on ok button.
- Save it.
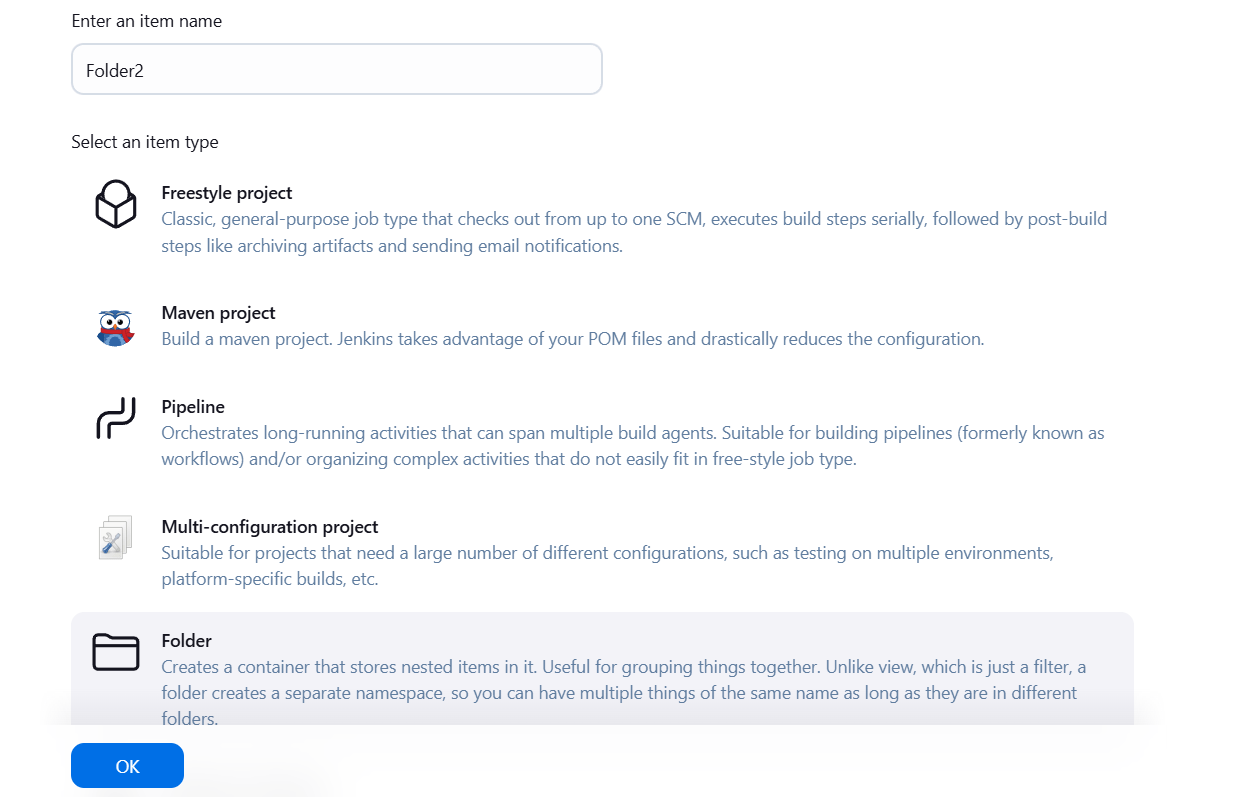
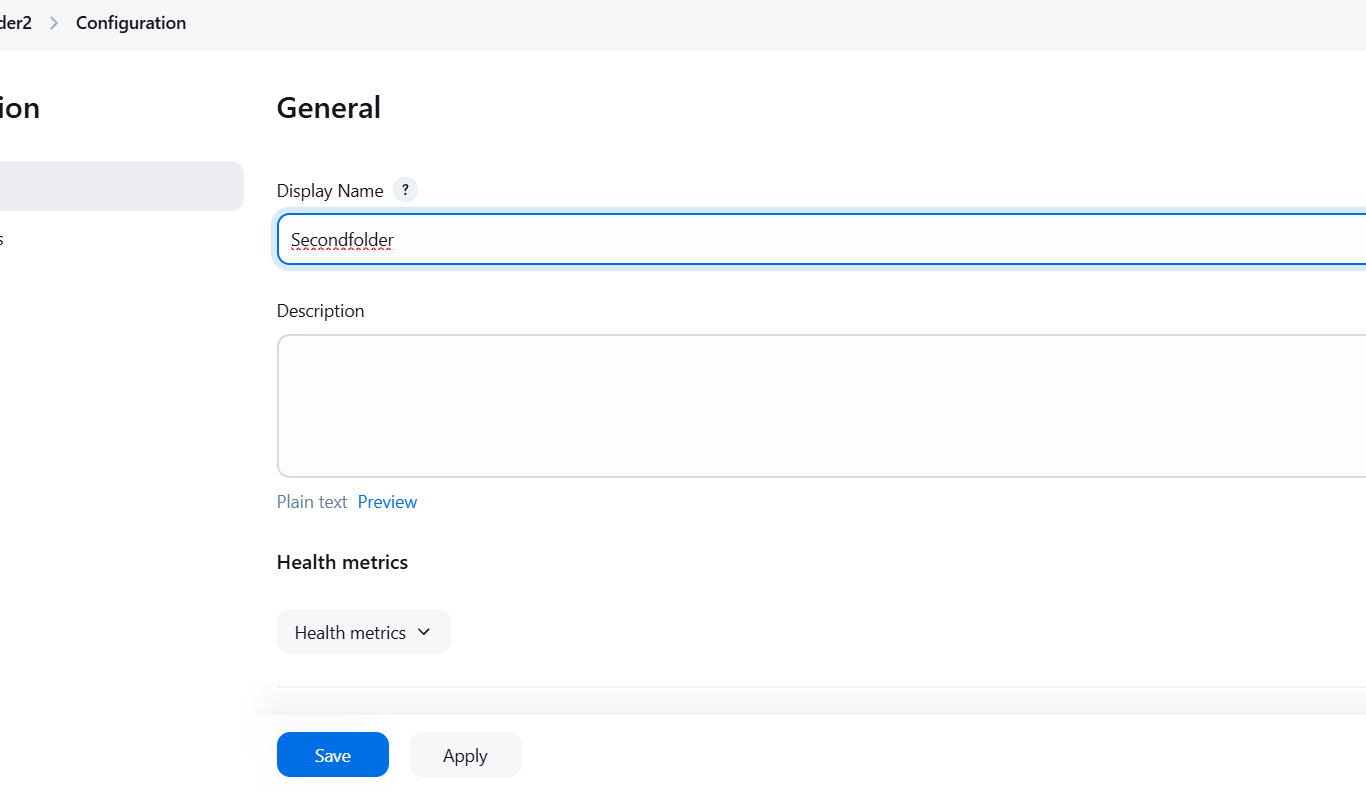
STEP 4: Move the first folder to Second folder.
- Select First folder click on move button.
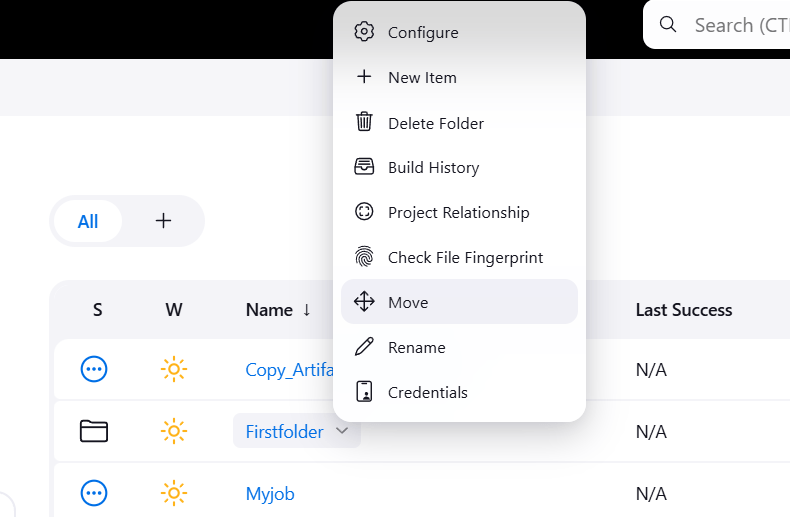
STEP 5: Select second folder and move button.
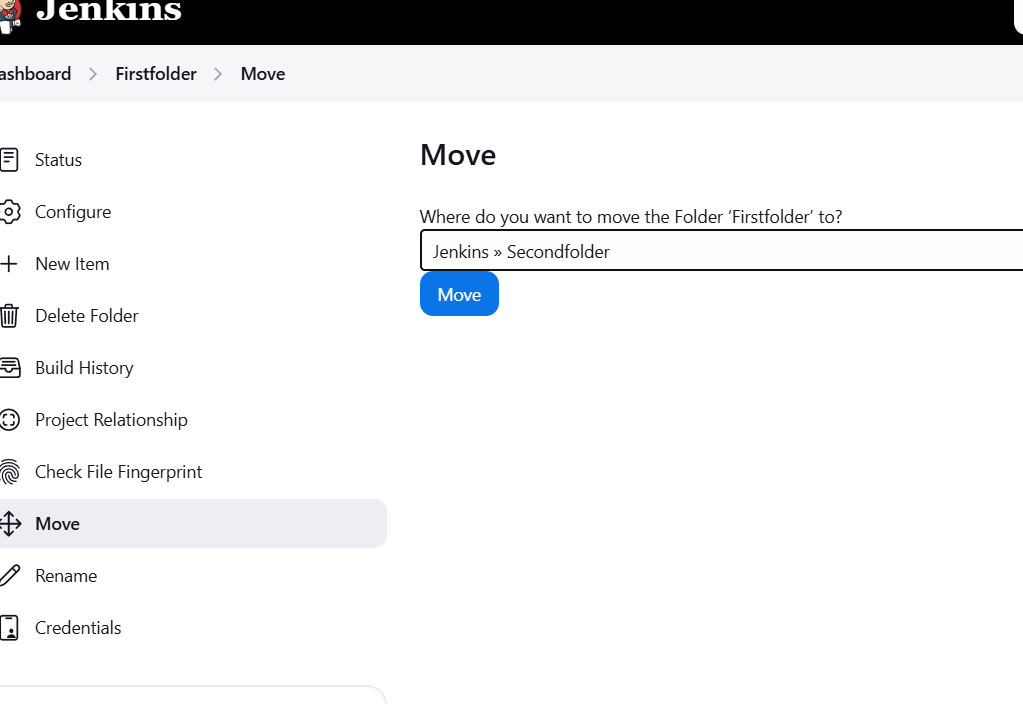
Step 6: Move on Job to First and second folder.
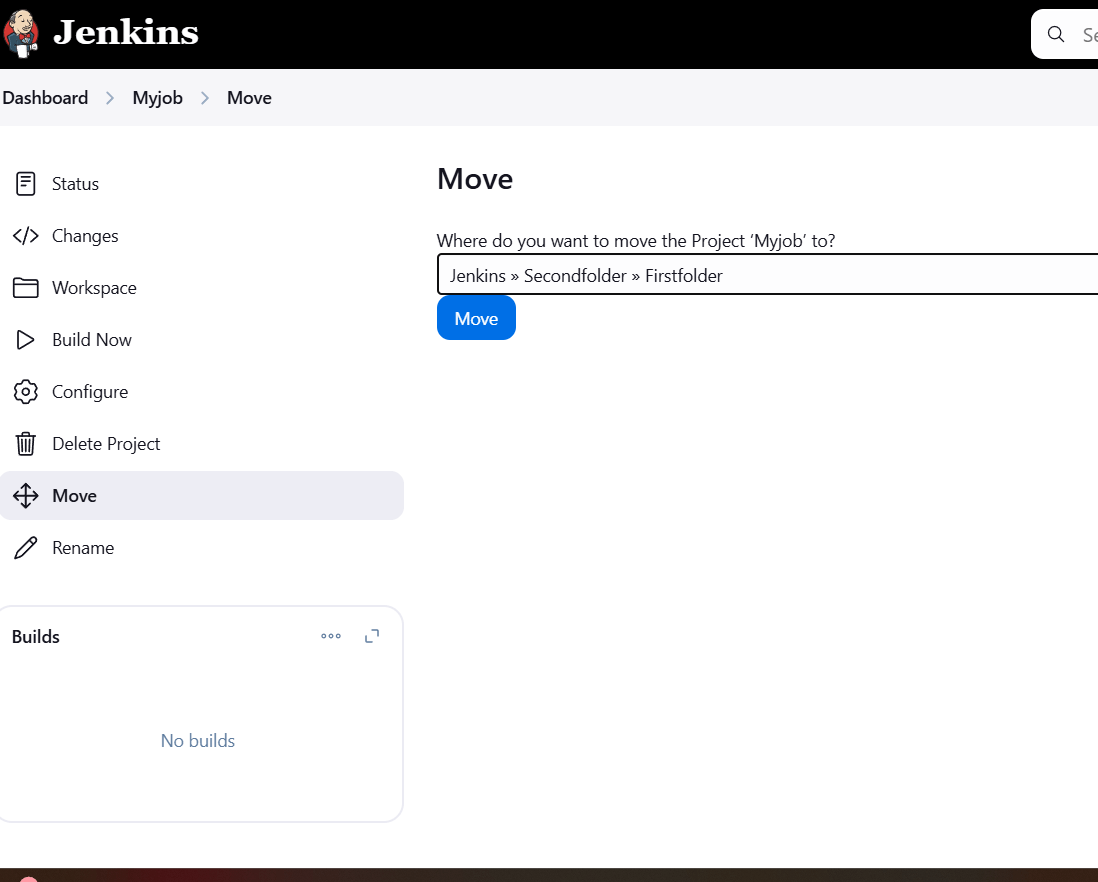
- Select myjob Click move button.
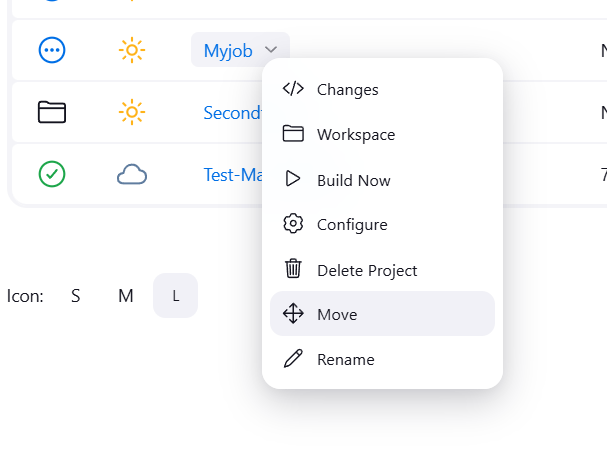
STEP 7: Select first folder and click on move.
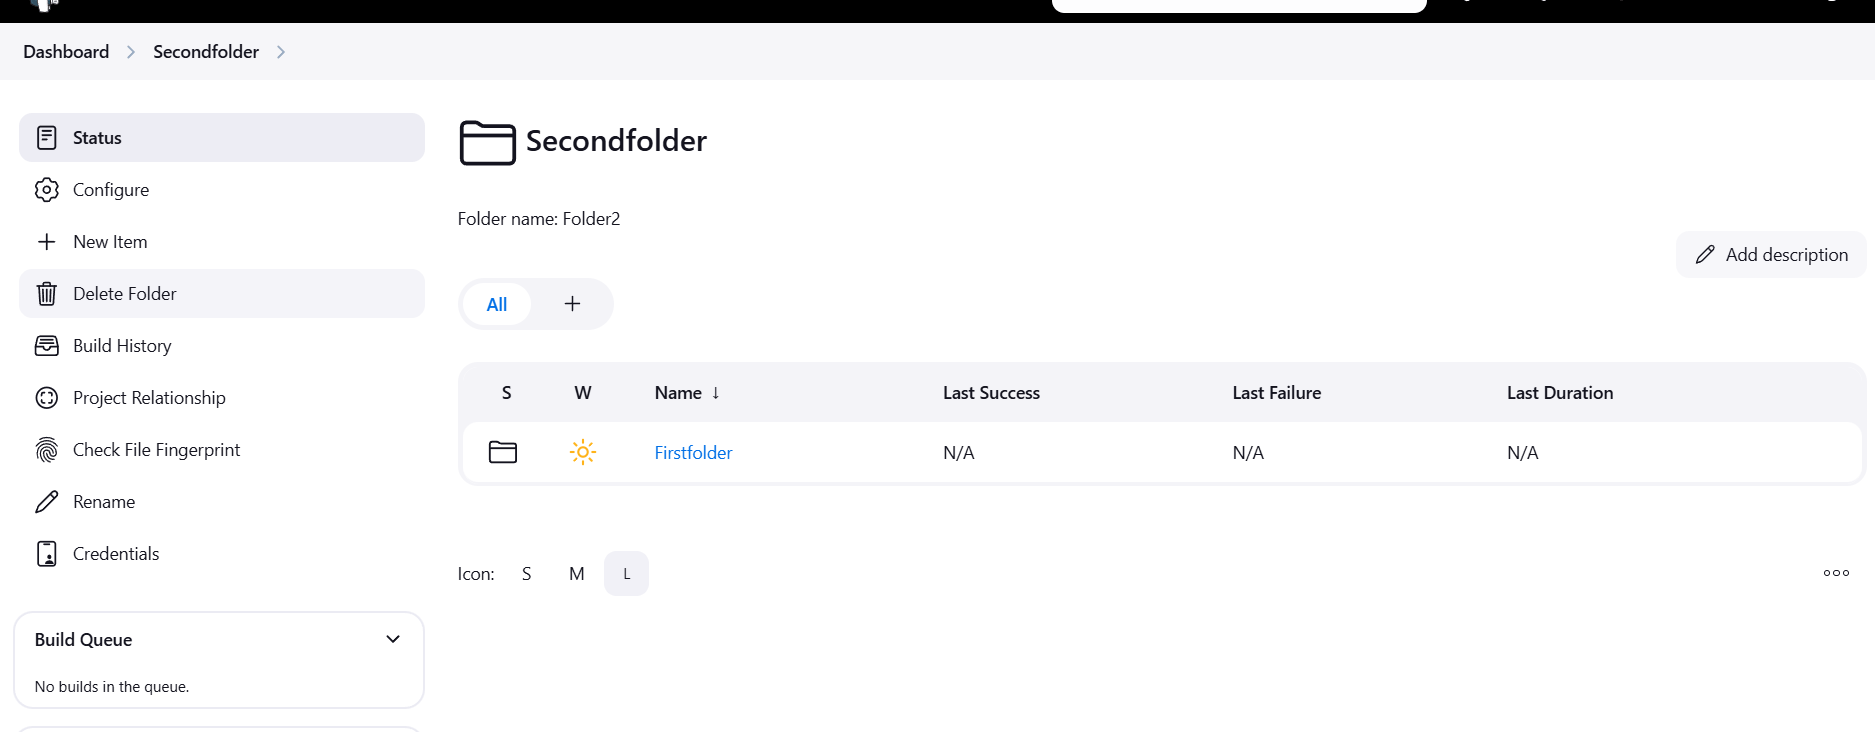
STEP 8: You will see this like.
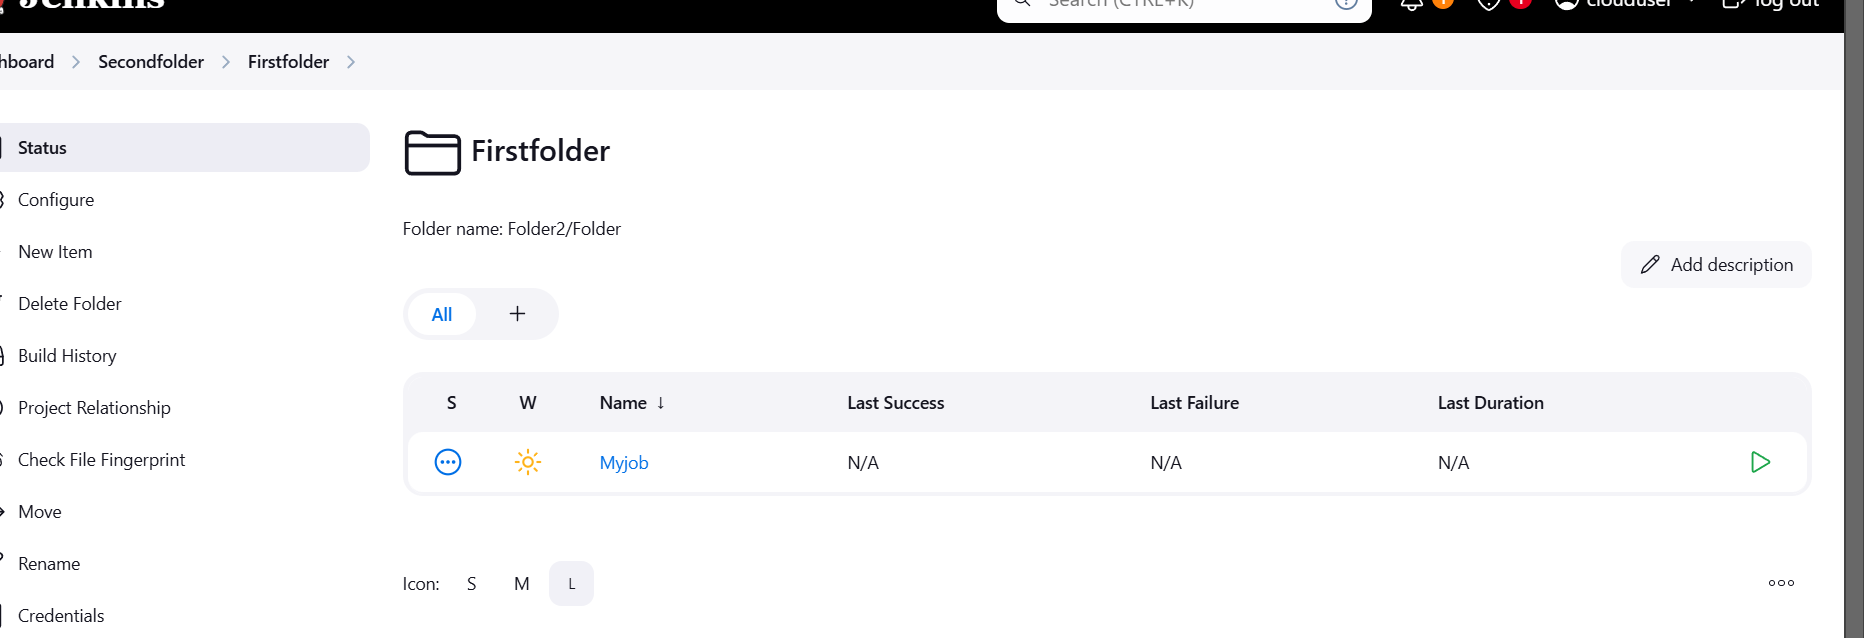

Conclusion.
In conclusion, the folders concept in Jenkins is a useful organizational tool that enhances job management, improves scalability, and simplifies access control in large Jenkins environments. It helps keep Jenkins instances clean and efficient, especially as the number of jobs grows.
Step-by-Step Guide to Creating an SQS Queue Using Terraform.
What is AWS SQS?
Amazon SQS (Simple Queue Service) Dead Letter Queues (DLQs) are a feature that helps manage message processing failures in your messaging workflows. When messages in a standard SQS queue fail to be processed successfully after a certain number of attempts, they can be automatically sent to a DLQ.
DLQs can also be monitored for metrics like the number of messages and errors, which can help you maintain the health of your messaging system.

What is Terraform?
Terraform is an open-source Infrastructure as Code (IaC) tool developed by HashiCorp, that lets you build, change, and version cloud and on-prem resources safely and efficiently in human-readable configuration files that you can version, reuse, and share.
Now, Create SQS in Terraform using VScode.
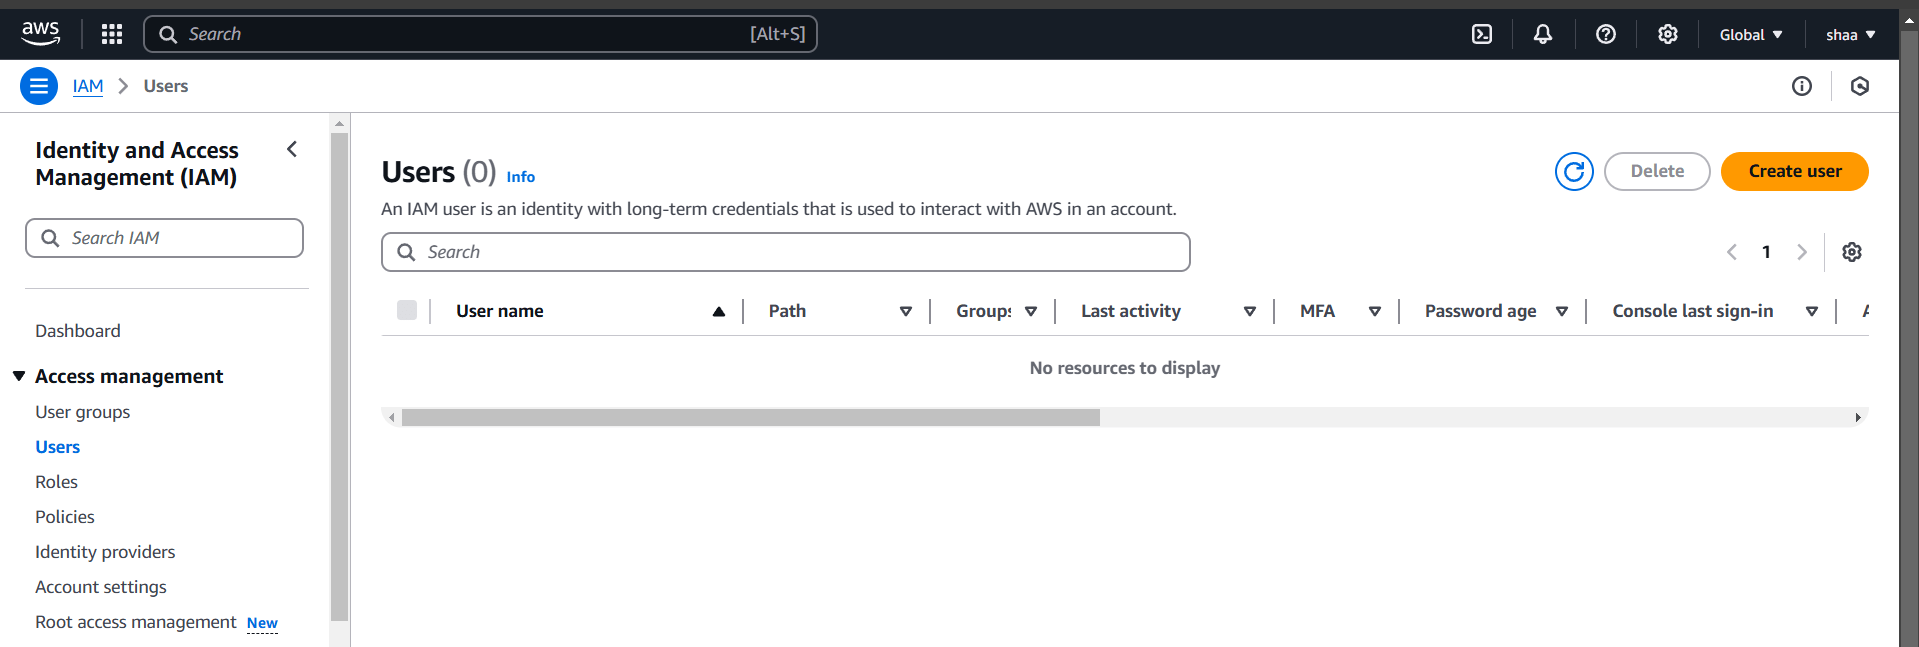
STEP 1: Navigate IAM and create Users.
- Click on create user.
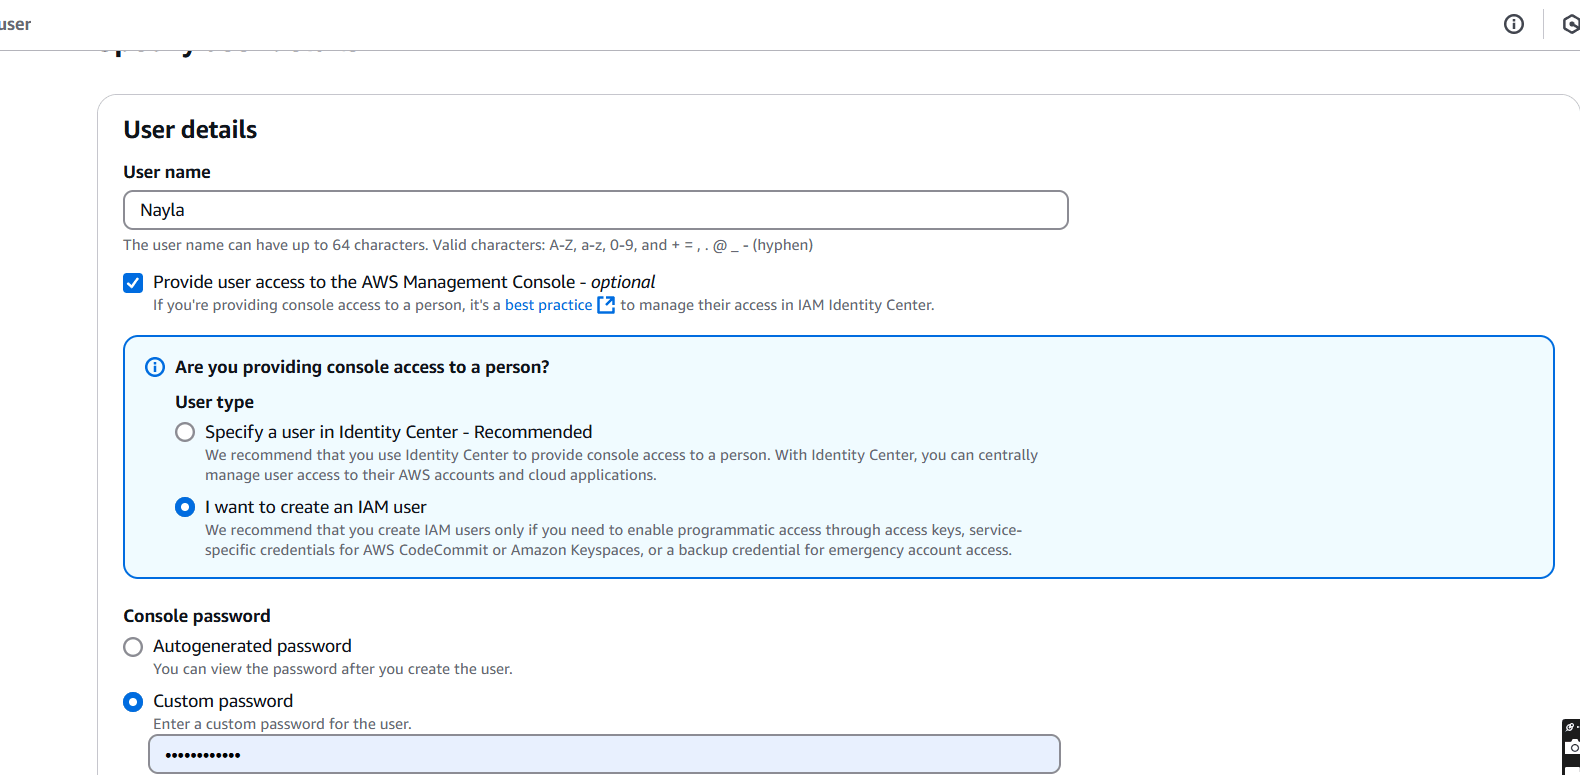
STEP 2: Enter the name and set password.
- Click on next button.
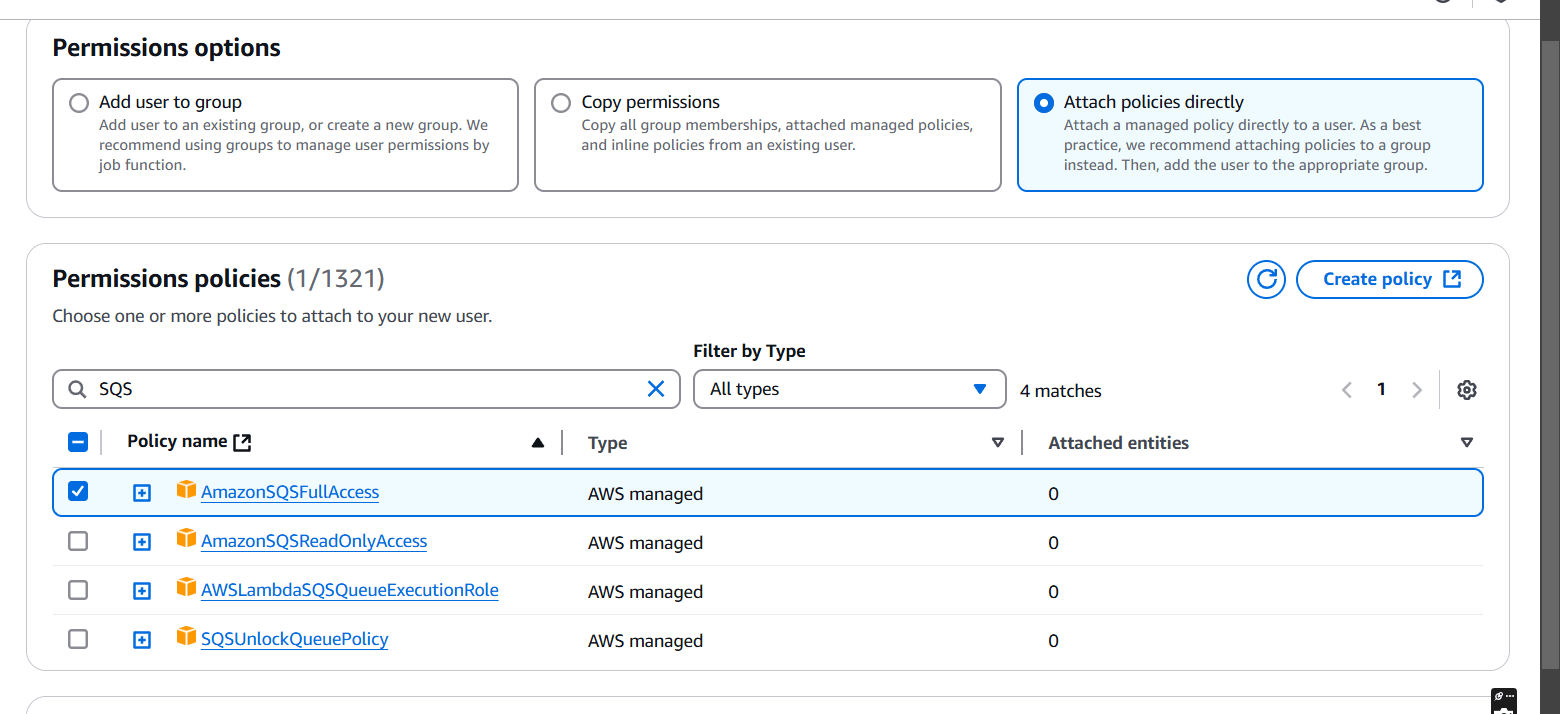
STEP 3: Select attach policies directly.
- Tick on Amazon SQS Fullaccess.
- Click create user.
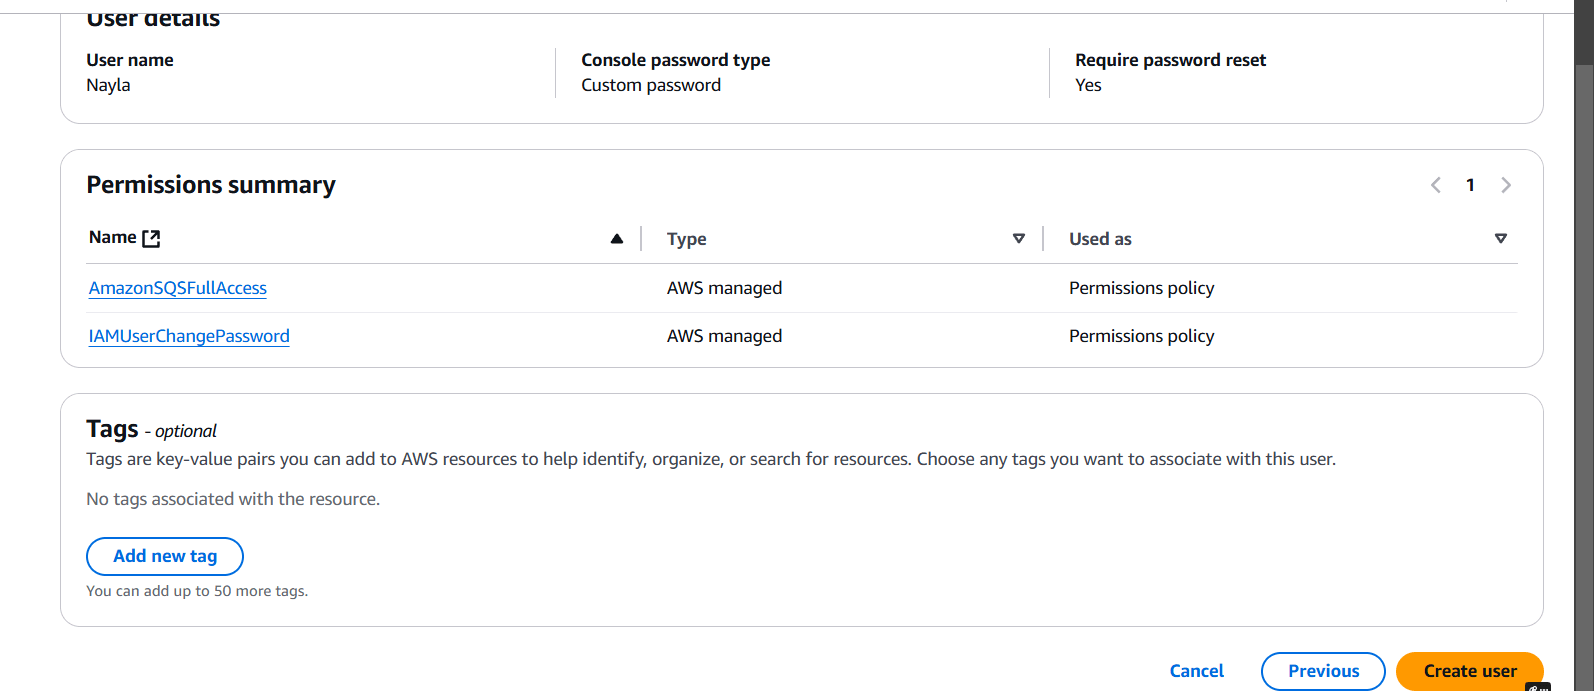
STEP 4: Click Return to user list.
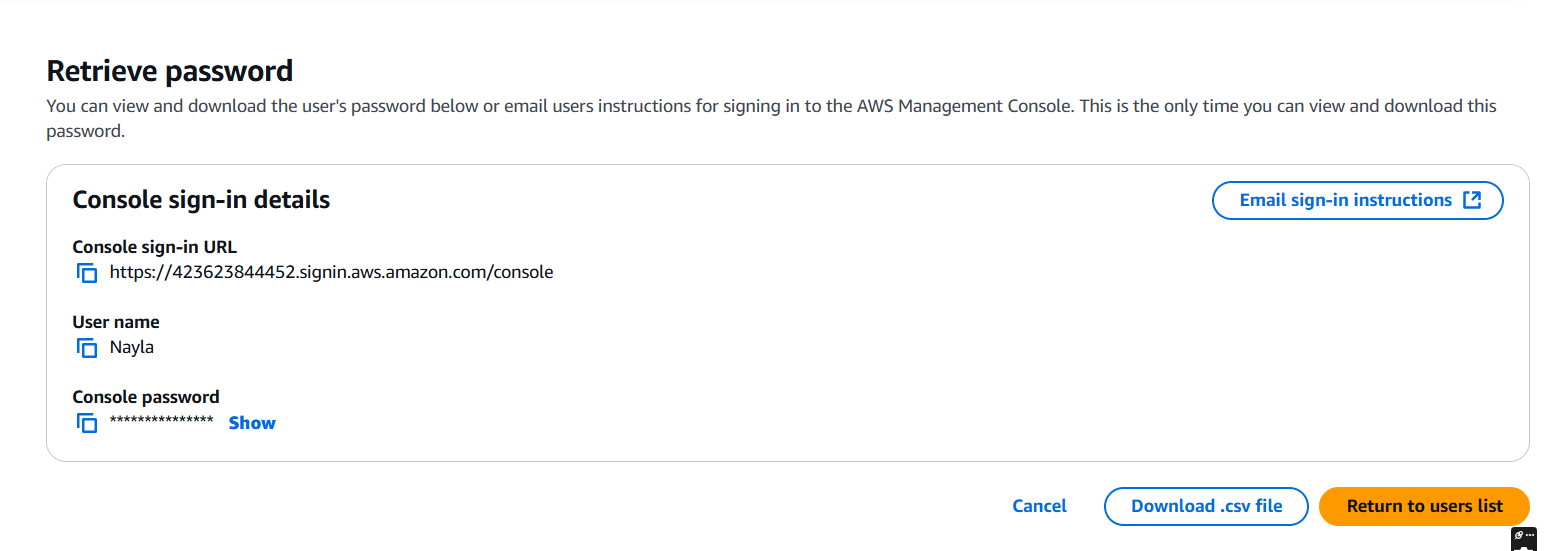
STEP 5: Click on your username.
- Create access key.
- Select CLI.

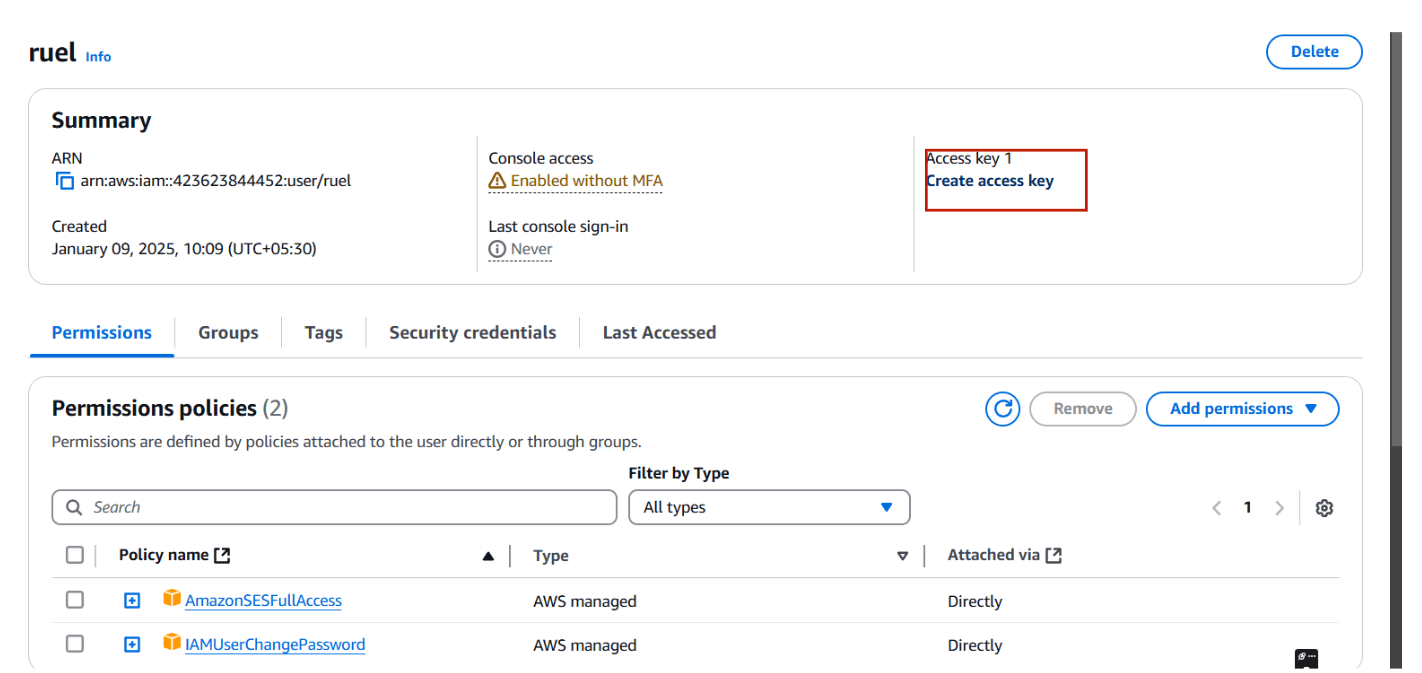
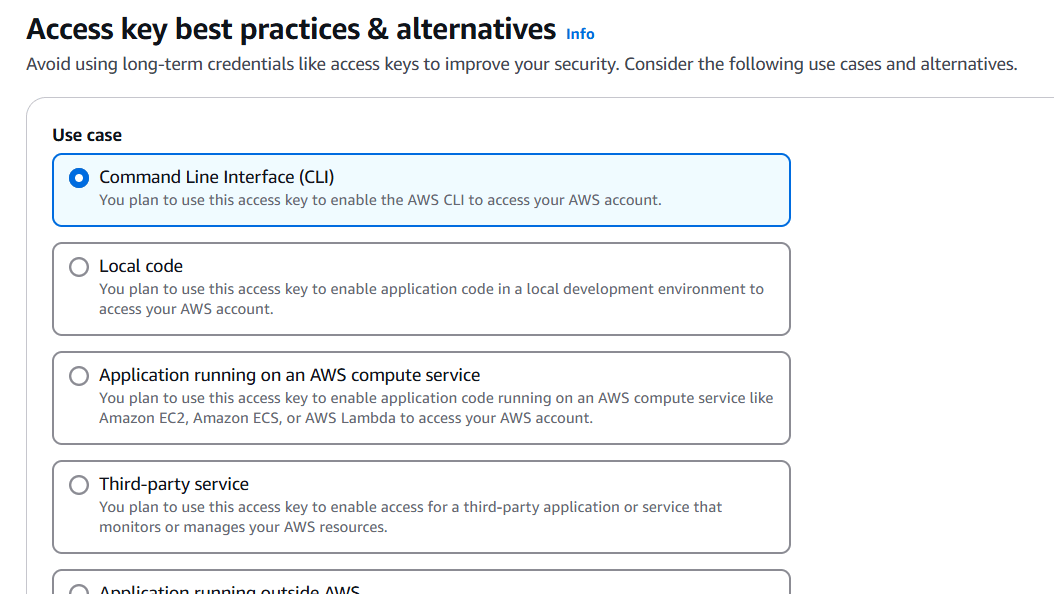
STEP 6: You will get a secret key and Access Key.
- If Download.csv file.

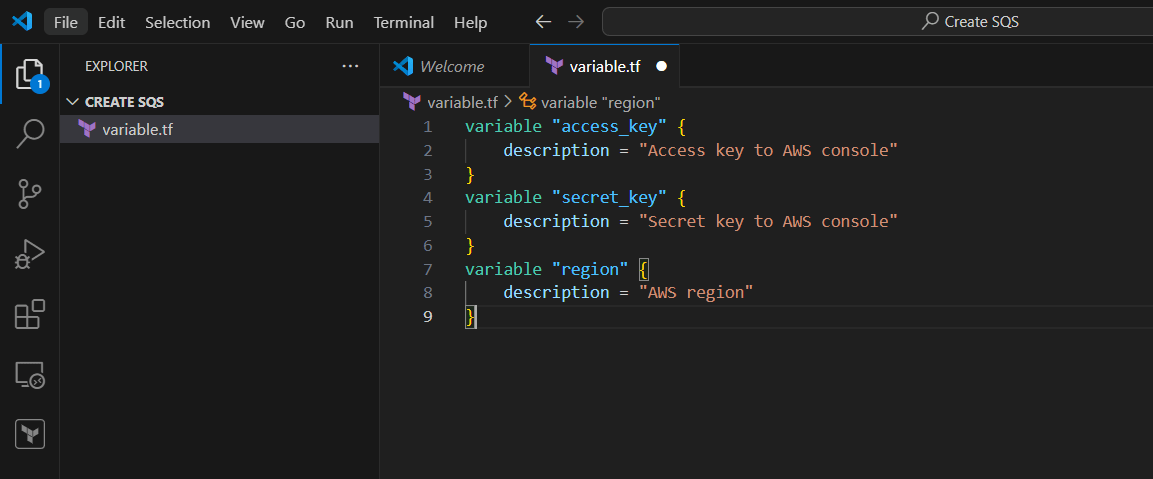
STEP 7: Go to VScode select your folder and create variable.tf file.
- Enter the following commands and save it.
variable "access_key" {
    description = "Access key to AWS console"
}
variable "secret_key" {
    description = "Secret key to AWS console"
}
variable "region" {
    description = "AWS region"
}
STEP 8: Next, Create terraform.tf file.
- Enter the command and save the file.
region = "us-east-1"
access_key = "<YOUR AWS CONSOLE ACCESS ID>"
secret_key = "<YOUR AWS CONSOLE SECRET KEY>"
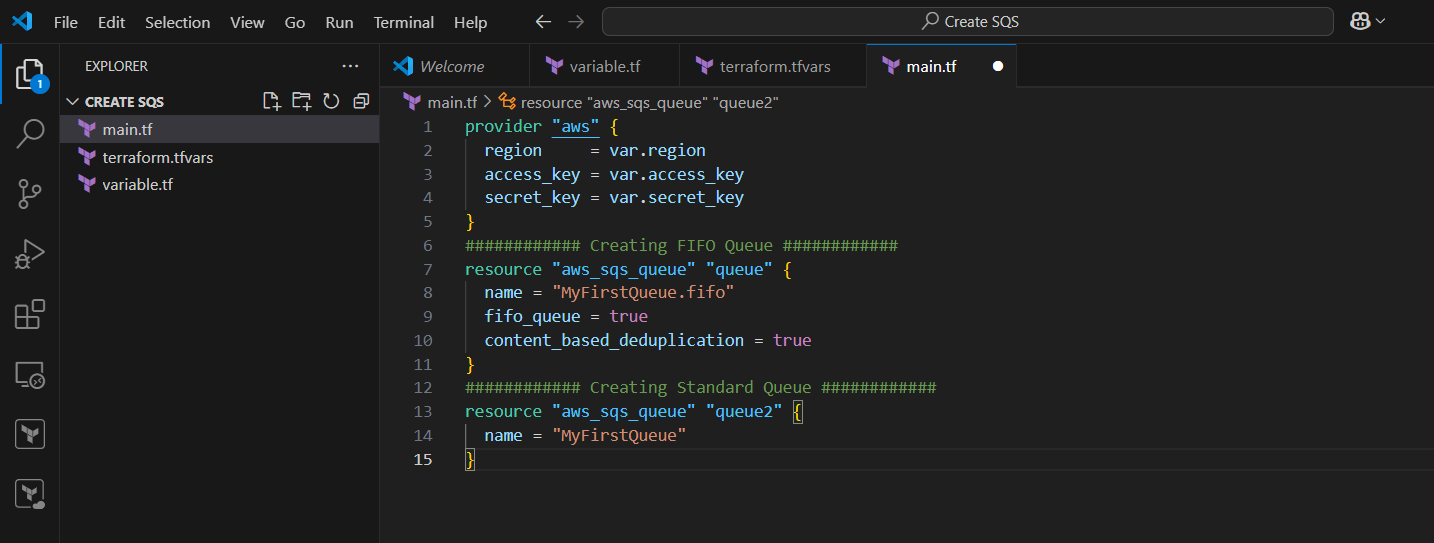
STEP 9: Create main.tf file.
provider "aws" {
  region     = var.region
  access_key = var.access_key
  secret_key = var.secret_key
}
############ Creating FIFO Queue ############
resource "aws_sqs_queue" "queue" {
  name = "MyFirstQueue.fifo"
  fifo_queue = true
  content_based_deduplication = true
}
############ Creating Standard Queue ############
resource "aws_sqs_queue" "queue2" {
  name = "MyFirstQueue"
}
STEP 10: Create output.tf file.
output "sqs-queue-arn" {
    value = aws_sqs_queue.queue.arn
}
output "sqs-queue2-arn" {
    value = aws_sqs_queue.queue2.arn
}
STEP 11: Open the terminal Enter terraform init.
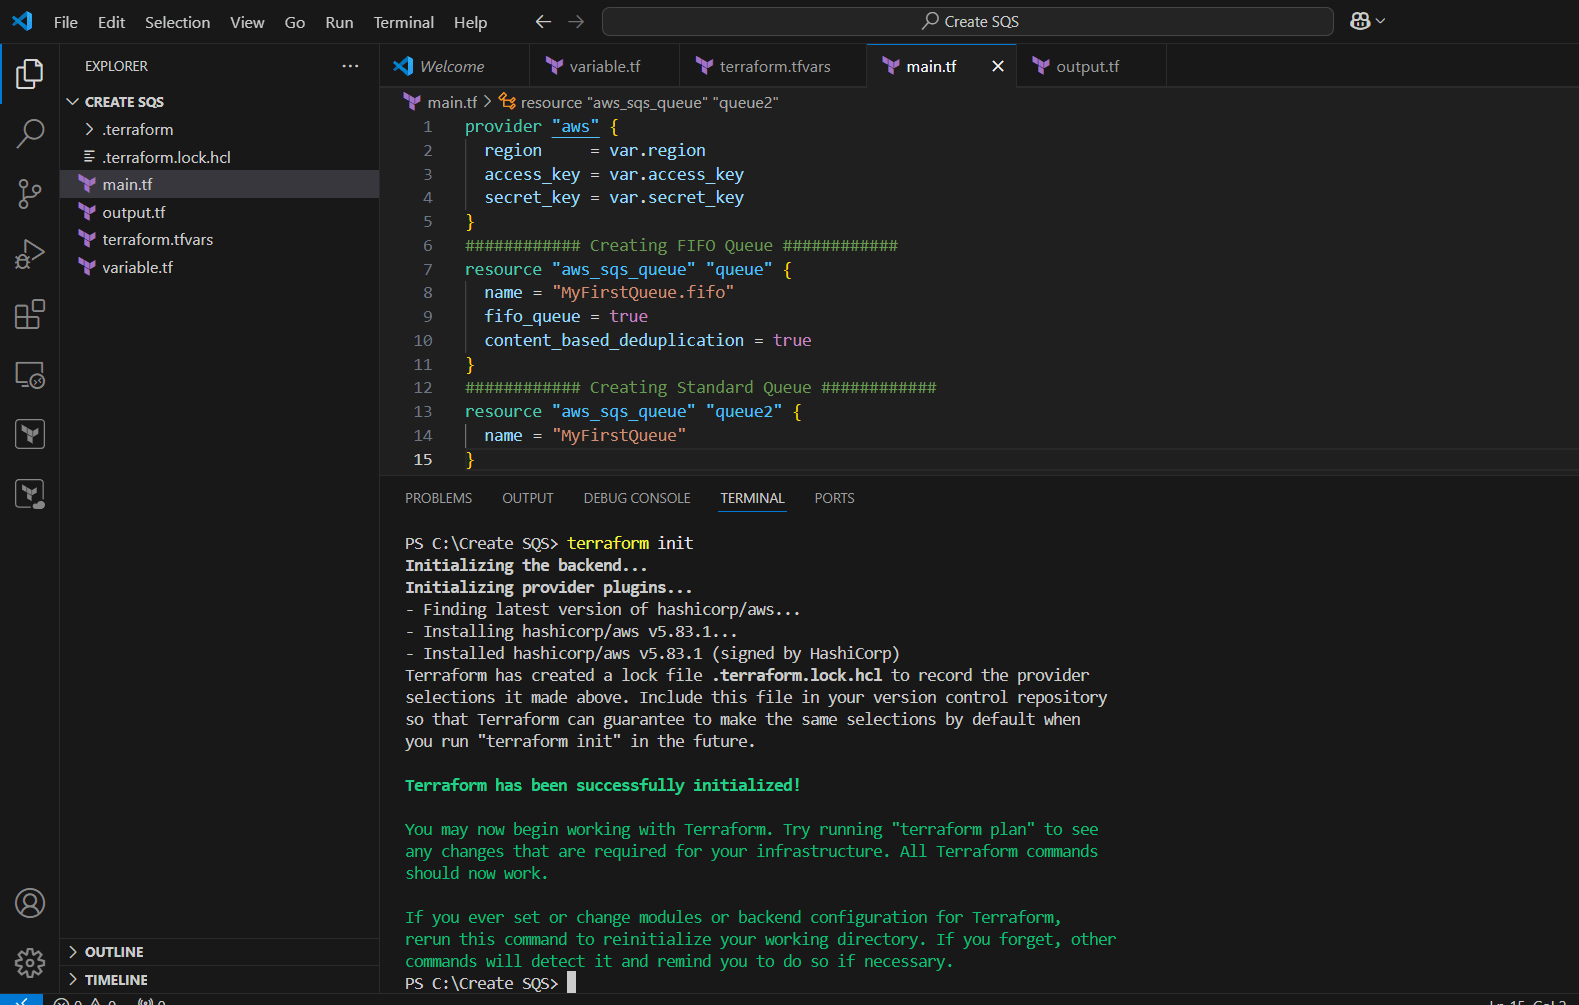
STEP 12: Next, Enter terraform plan command.
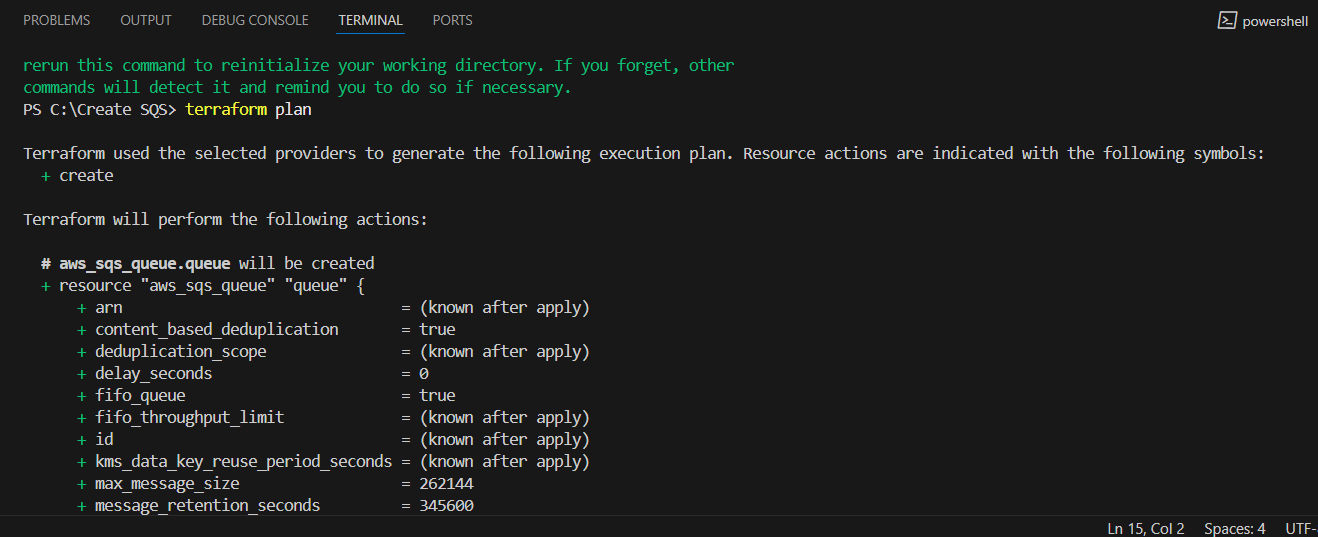
STEP 13: Enter terraform apply.
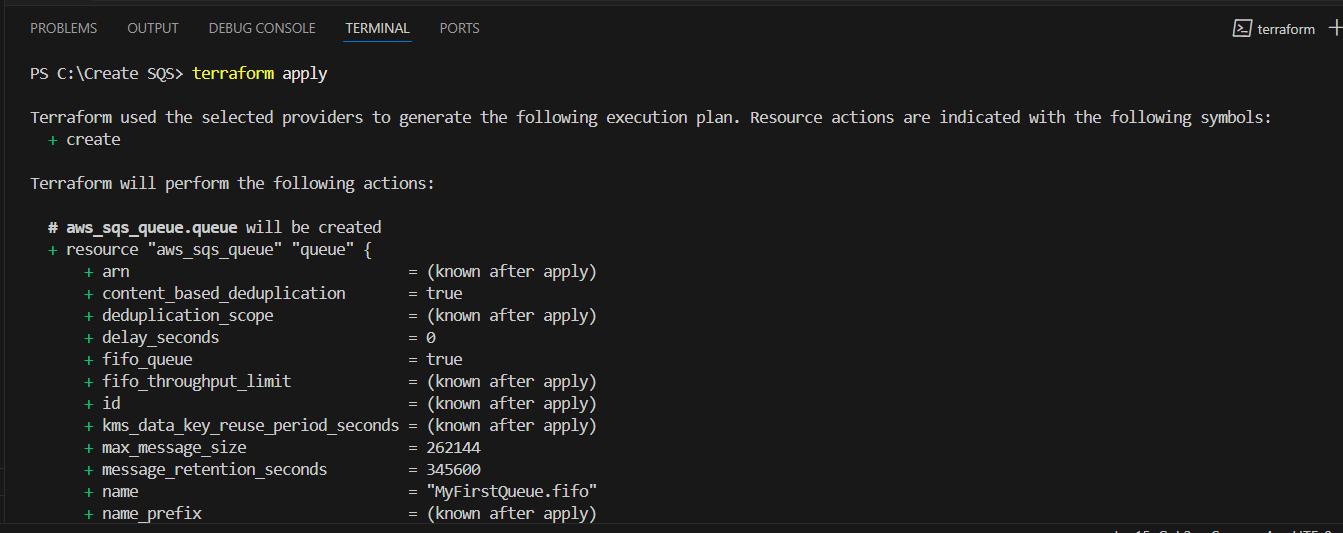
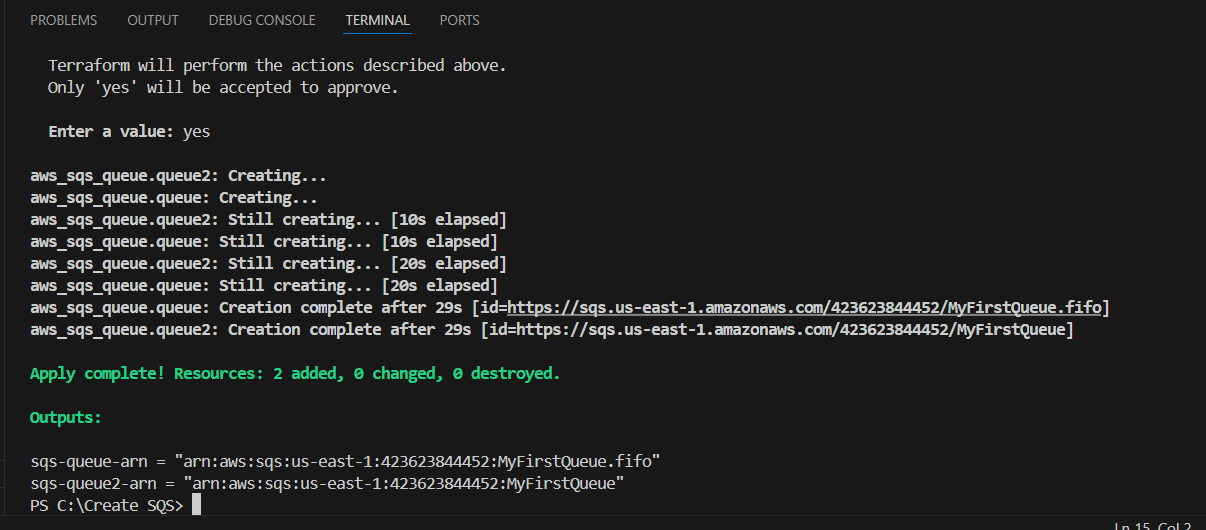
STEP 14: Go AWS SQS You can see two queues are created successfully.

STEP 15: If you delete the Queue use the terraform destroy command.


Conclusion.
By following these steps, you’ve successfully created an SQS Queue using Terraform, enabling you to manage your message queues in a scalable and automated manner. Terraform’s infrastructure-as-code approach makes it easier to maintain, version, and automate your AWS resources, ensuring a streamlined workflow.
Automating Email Service Creation with SES and Terraform.
AWS SES.
Amazon Simple Email Service (Amazon SES) is a scalable, cost-effective, and flexible cloud-based email service designed for businesses to send bulk and transactional emails. Its provides feedback loops, sending analytics, and built-in content filtering to enhance deliverability. SES supports multiple configurations for dedicated IPs, IP warm-up, and domain authentication, ensuring reliable deliverability.

What is Terraform?
Terraform is an open-source Infrastructure as Code (IaC) tool developed by HashiCorp, that lets you build, change, and version cloud and on-prem resources safely and efficiently in human-readable configuration files that you can version, reuse, and share.
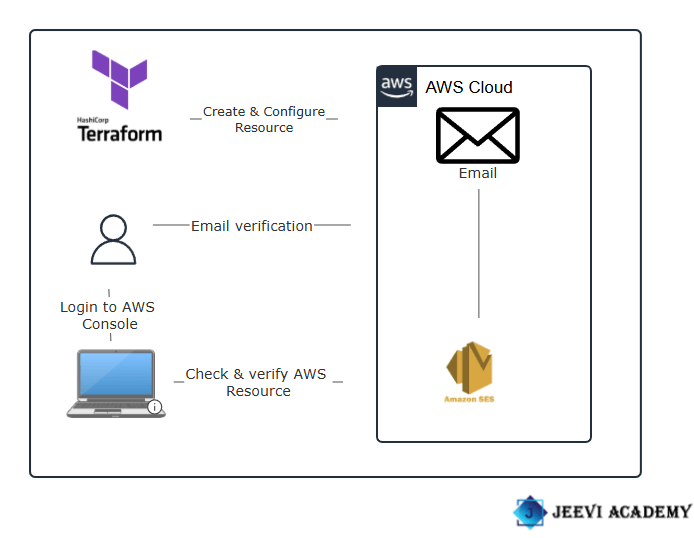
In this guide, I’ll walk you through sending notifications using AWS SES and a Terraform script, all while working with Visual Studio Code (VSCode).
TASK 1: Create a terraform script.
STEP 1: Open VScode and select the folder.
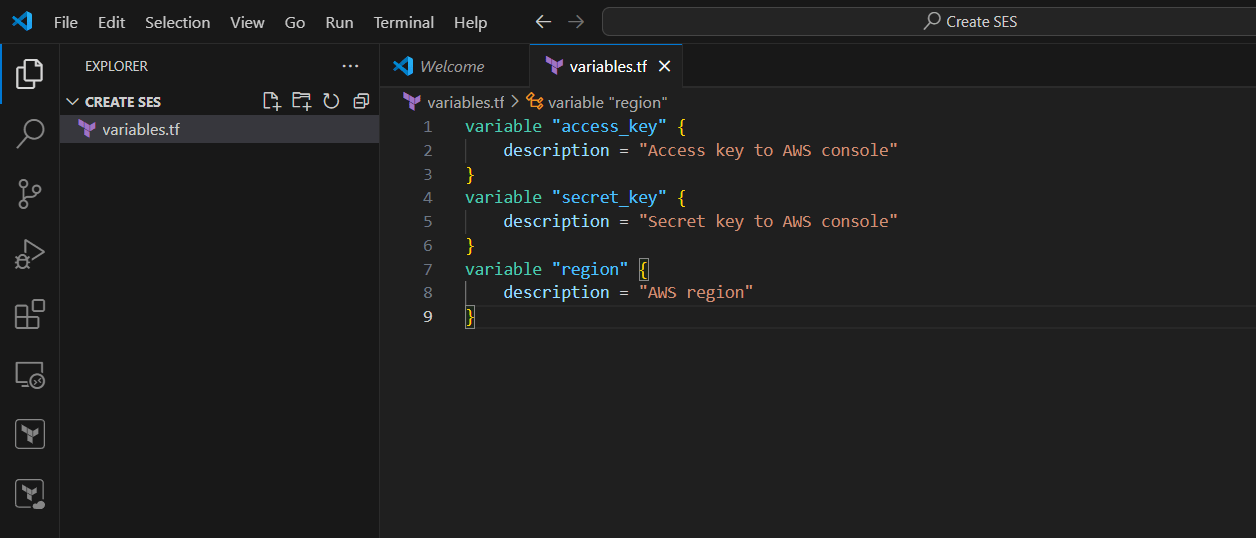
- Create a variables.tf file enter the following script and save it.
variable "access_key" {
    description = "Access key to AWS console"
}
variable "secret_key" {
    description = "Secret key to AWS console"
}
variable "region" {
    description = "AWS region"
}
TASK 2: Create IAM user.
STEP 1: Go to AWS console and navigate the IAM user.
- Click create user.
- Enter name and set password.
- Click on next button.

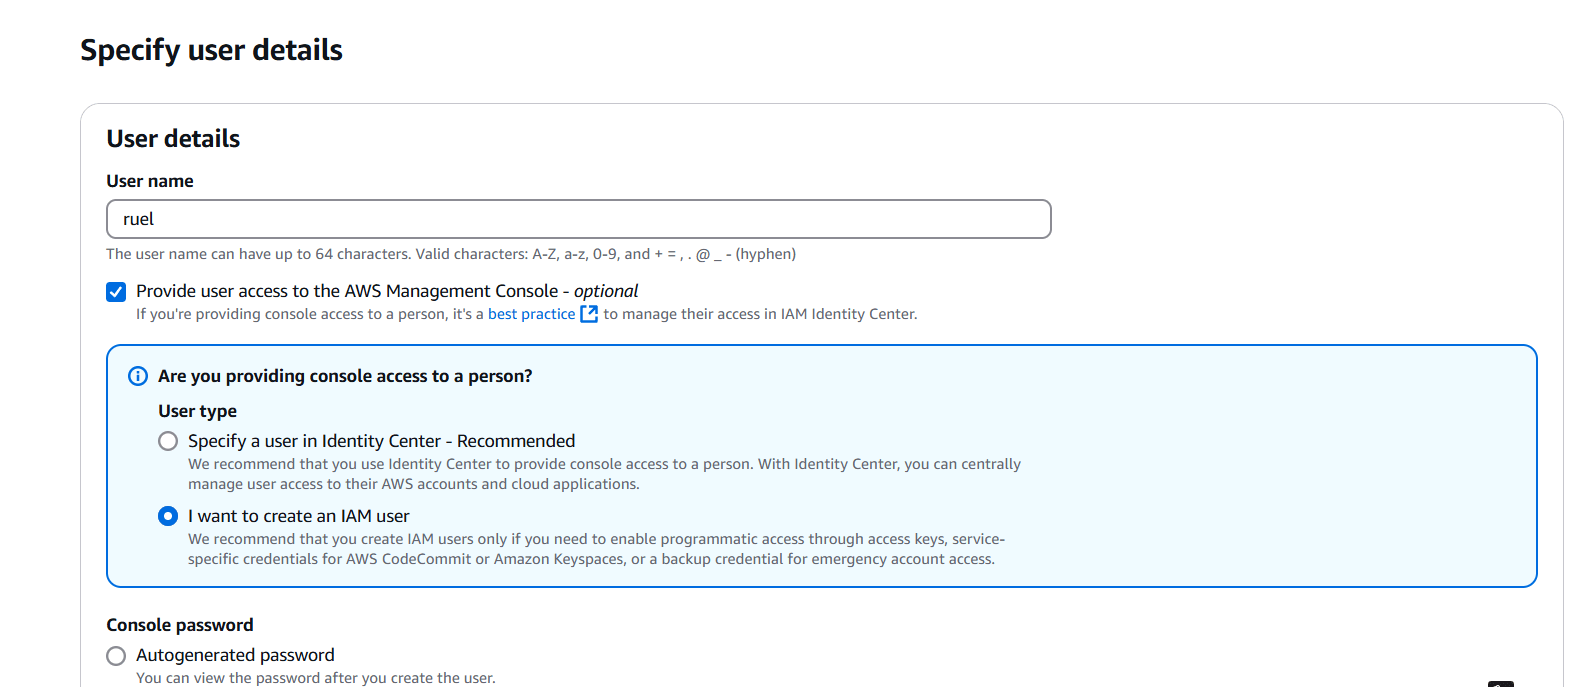
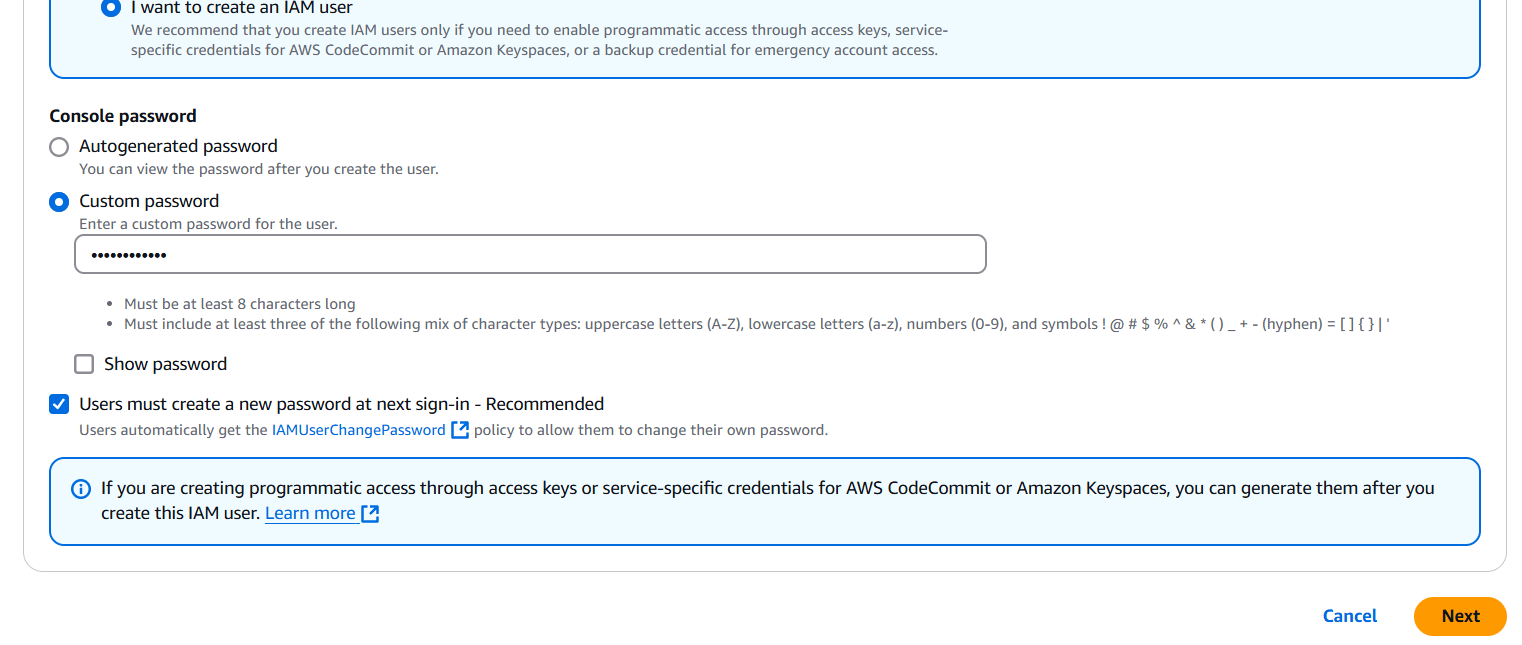
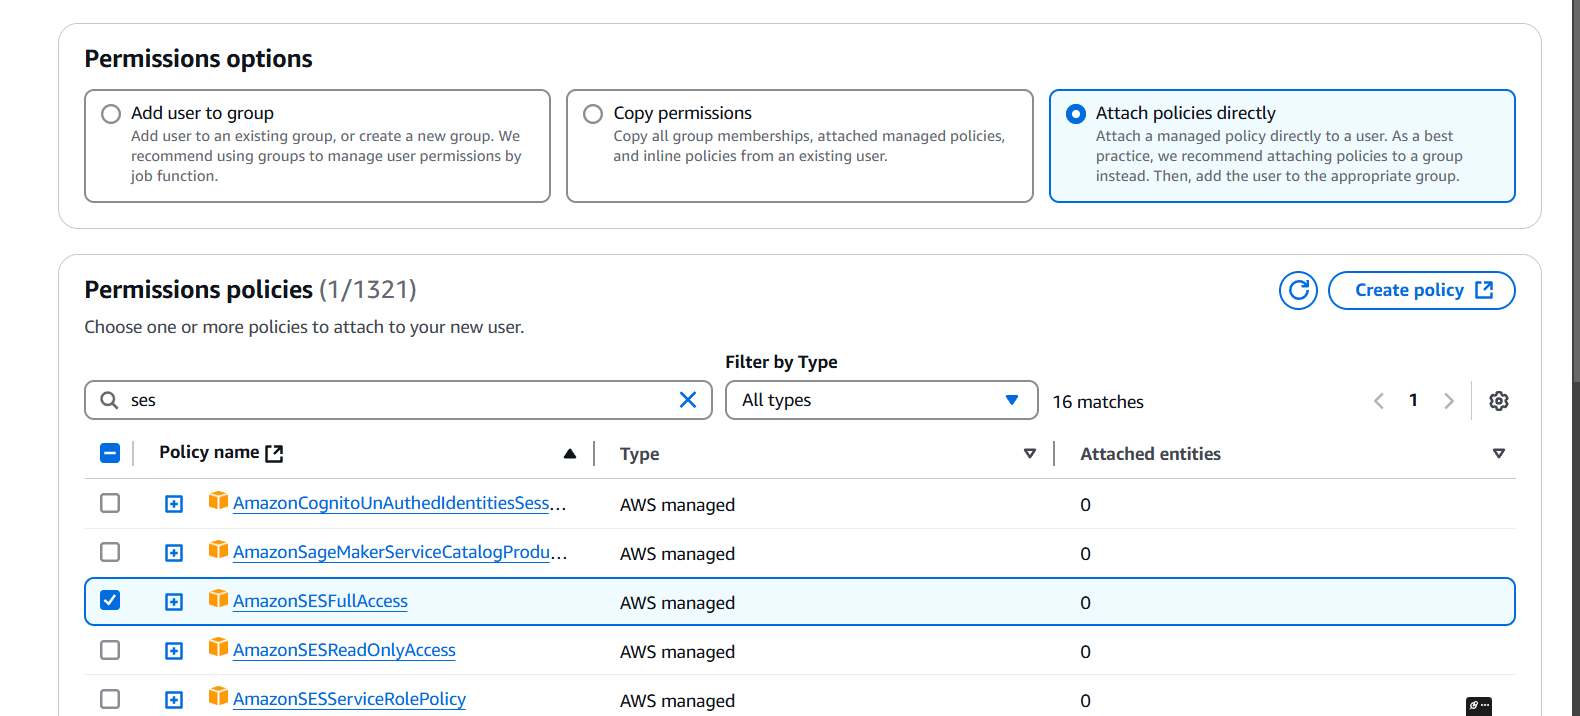
STEP 2: Select the Attach policies directly.
- Tick on AmazonSESfullaccess.
- Click on next button.
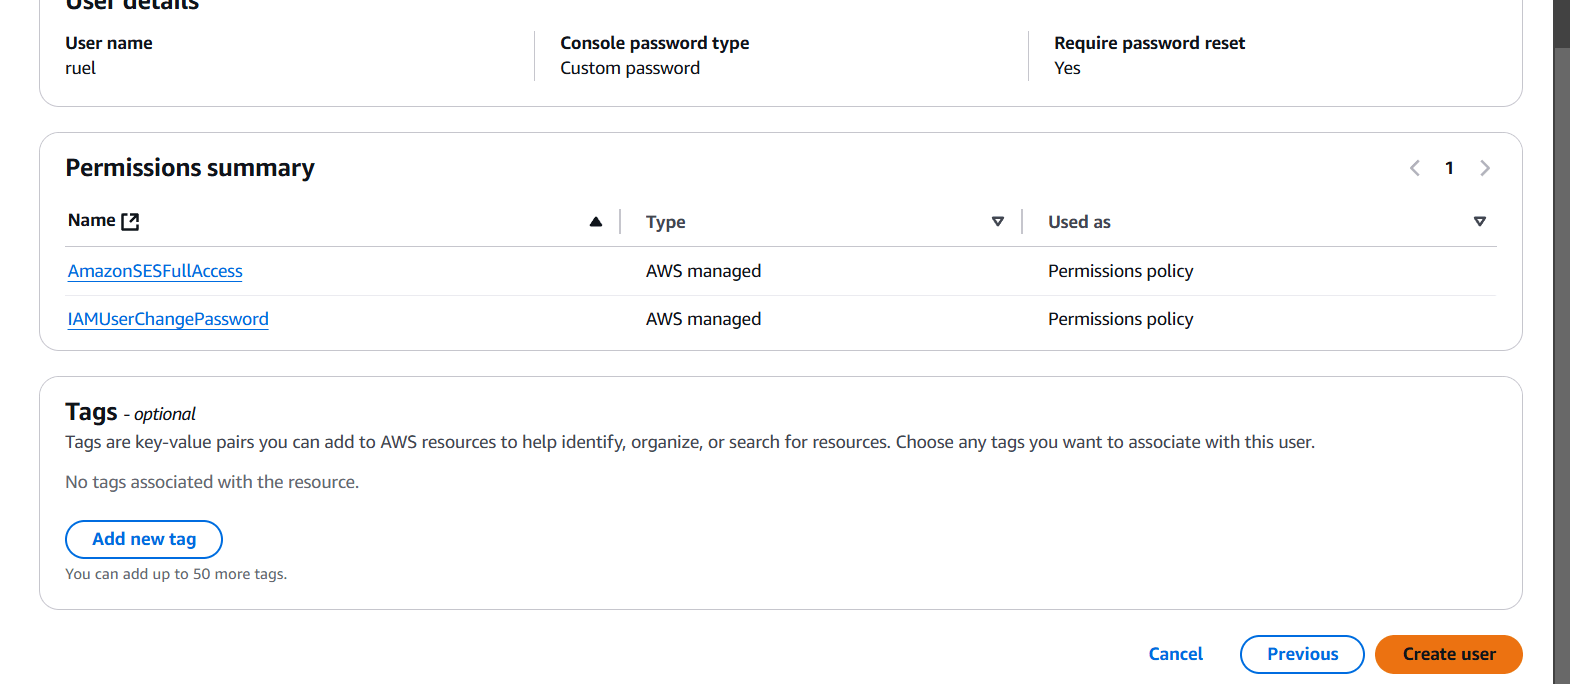
STEP 3: Click on create user.
STEP 4: Select your user and create access key.
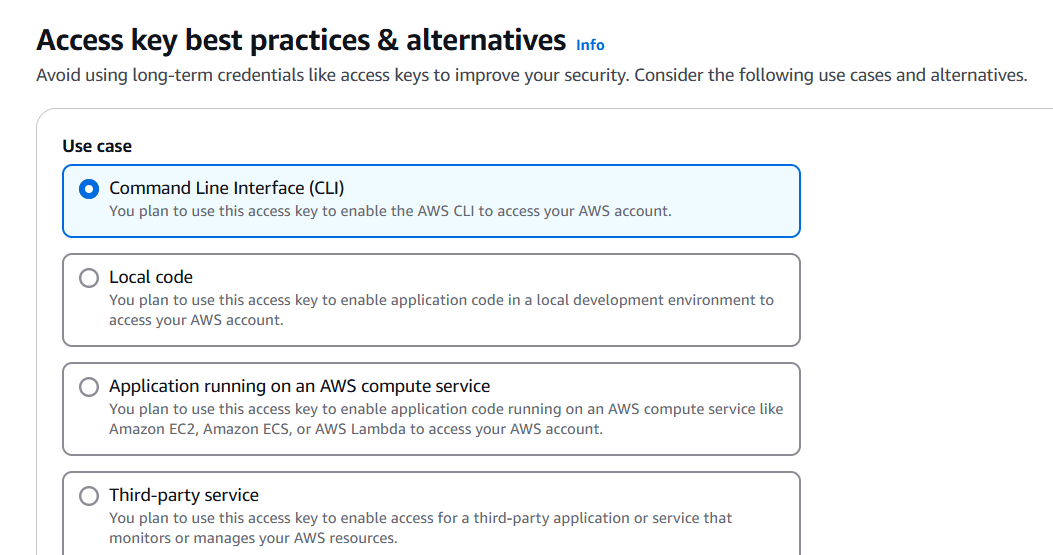
- Select CLI and click next.
- Create a user.
- You will get accesskey and secret key.
- Download.csv file


Step 5: Next create terraform.tfvars file, Save it
region = "us-east-1"
access_key = "<YOUR_ACCESS_KEY>"
secret_key = "<YOUR_SECRET_KEY>"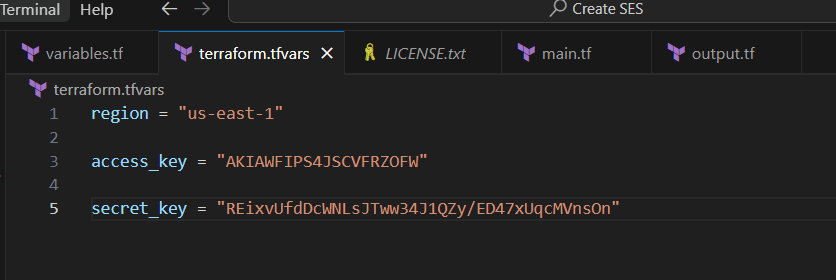
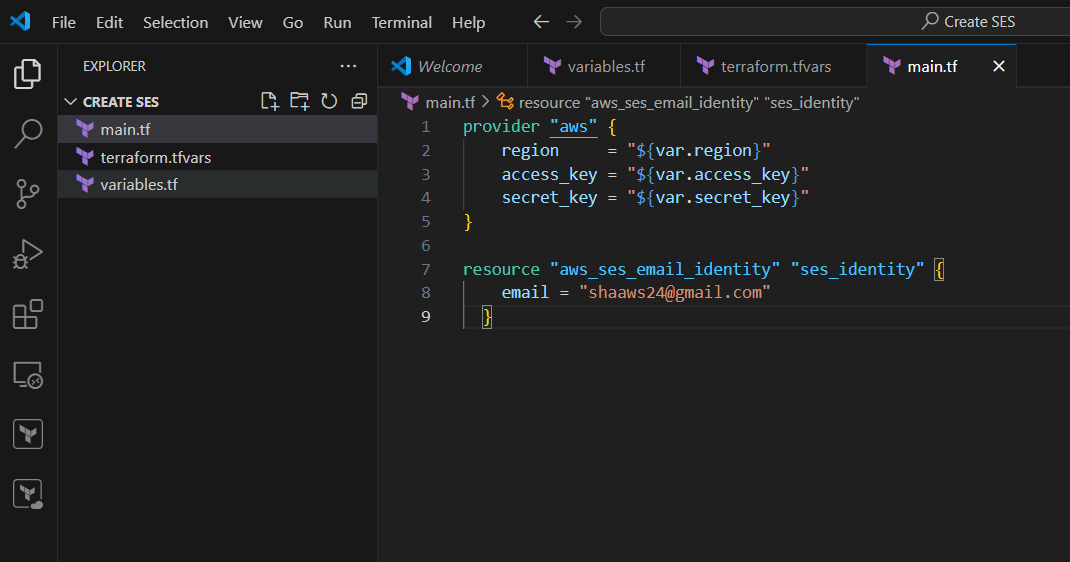
Step 6: Create main.tf email = “your mail”
- Save the file.
resource "aws_ses_email_identity" "ses_identity" {
    email = "Enter you Email"
  }
STEP 7: Create output.tf file, Enter the following lines and save it.
output "Identity_arn" {
    value = aws_ses_email_identity.ses_identity.arn
    description = "Identity created successfully"
}
TASK 3: Apply the terraform script.
STEP 1: Enter the terraform init command.
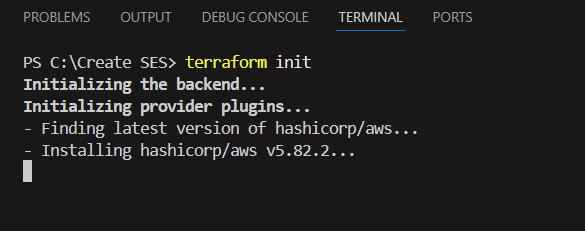
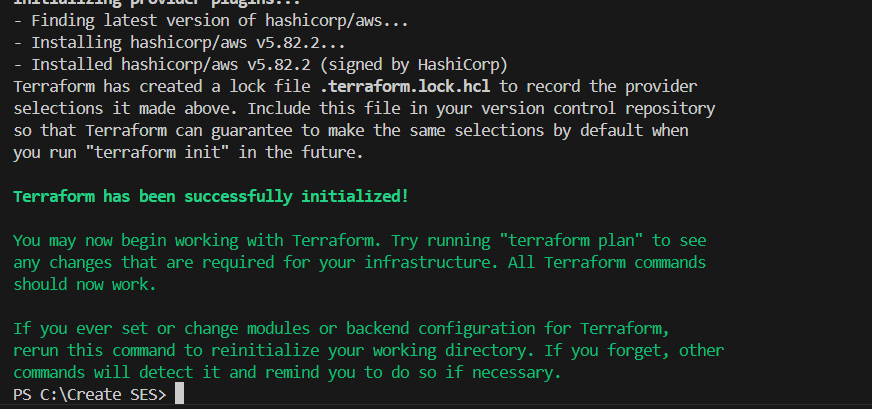
STEP 2: Enter terraform plan.

STEP 3: Next, enter terraform apply.

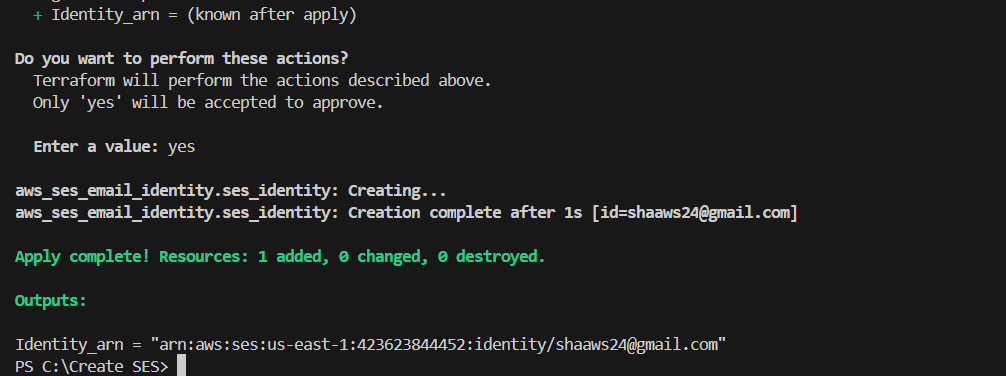
TASK 4: Verify the Email Notification.
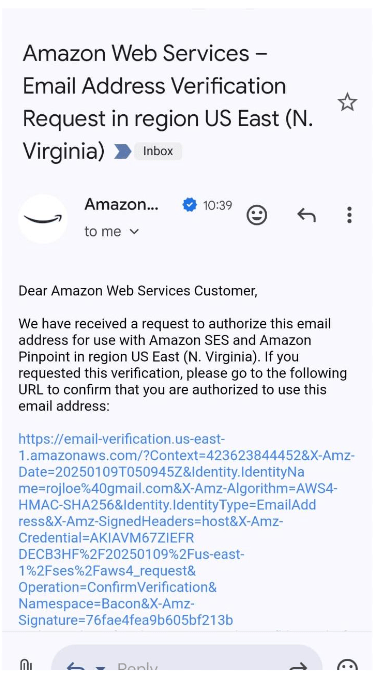
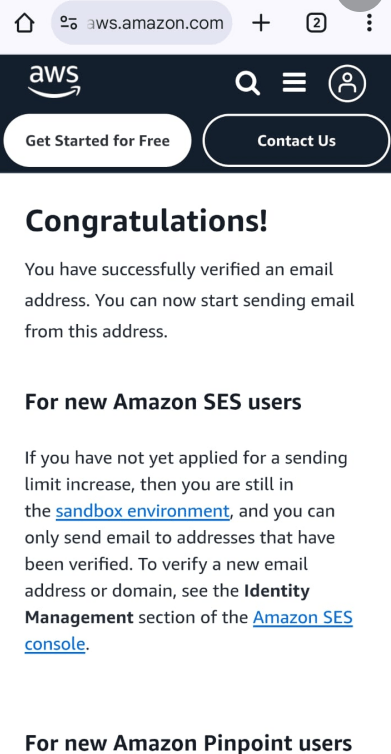
STEP 1: Now, You will go to check your mail.
- Mail notification from AWS.

STEP 2: If you delete Enter the terraform destroy.


Conclusion.
In this tutorial, we’ve successfully walked through the process of setting up an SES email service using Terraform. By leveraging Terraform’s infrastructure-as-code capabilities, we’ve not only automated the provisioning of the necessary AWS resources but also ensured that the process is repeatable and scalable. Whether you’re sending transactional emails, notifications, or newsletters, using SES with Terraform makes managing your email infrastructure seamless and efficient.
With this setup, you’re now ready to integrate SES with your applications and start sending email notifications. Remember, Terraform gives you the flexibility to manage your infrastructure in a controlled, consistent way—an essential practice for building robust cloud architectures.
Feel free to explore more AWS services and Terraform modules to further optimize and scale your infrastructure. Happy coding!
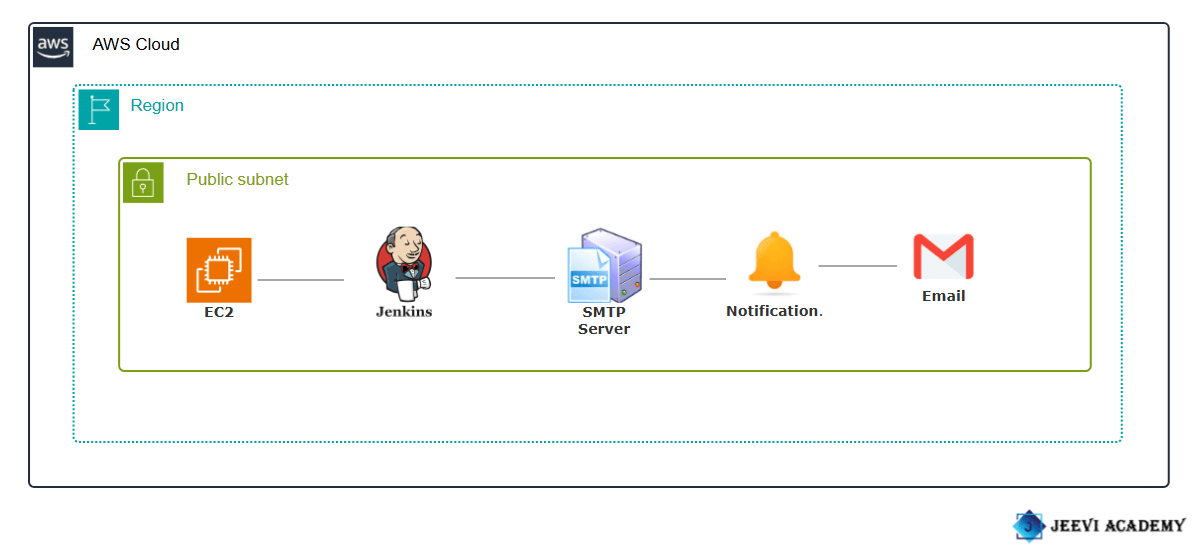
How to Set Up and Optimize Notifications in Jenkins.
Introduction.
What is Jenkins?
Jenkins is an open-source automation server widely used in software development to automate the process of building, testing, and deploying applications. It supports Continuous Integration (CI) and Continuous Delivery (CD), which are key practices in modern DevOps workflows. With its extensive plugin ecosystem, Jenkins can integrate with numerous tools and technologies, making it highly adaptable to different workflows and environments. It helps teams detect issues early, improve software quality, and accelerate delivery times.

Notifications in Jenkins?
In Jenkins, notifications are a way to alert users or systems about the status of Jenkins jobs (builds, tests, deployments, etc.). Notifications can be configured to inform the relevant stakeholders (developers, testers, DevOps teams, etc.) when a build or pipeline succeeds, fails, or encounters any other significant event. These notifications help to ensure that teams can take timely action to address issues, monitor progress, and improve the overall development and deployment process.
Benefits.
- Real-Time Feedback: Immediate notification of build status allows teams to respond quickly to issues, reducing the time between detection and resolution.
- Faster Issue Detection and Resolution: By notifying teams about build failures, test issues, or deployment errors, Jenkins helps detect problems early in the development cycle.
- Automated Issue Detection: With notifications, any issues in the build pipeline are immediately flagged, enabling faster troubleshooting and minimizing downtime.
- Increased Reliability and Quality Assurance: Automated notifications ensure that critical issues like build failures or test failures are not overlooked, improving the reliability and quality of the software.
- Visibility and Transparency: Notifications give stakeholders visibility into the pipeline’s progress, build results, deployment status, and test outcomes.
- Improved Collaboration: Notifications ensure that all stakeholders are informed about the progress or failure of builds, deployments, and tests, enhancing collaboration across teams.
Requirements:
- Create a EC2 instance.
- Accessing EC2 with SSH.
- Install java and jenkins file.(https://www.jenkins.io/doc/book/installing/)
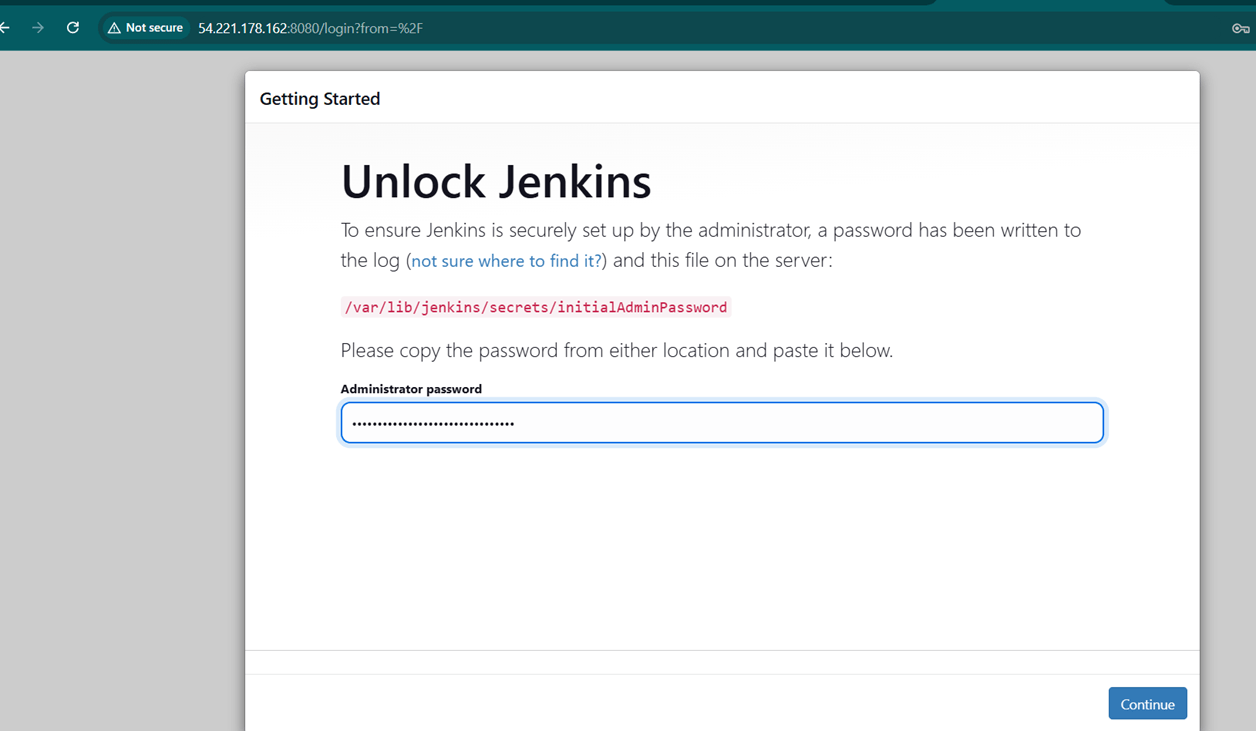
- Enter your browser your IP with port number(8080).
STEP 1: Enter the password and click continue button.
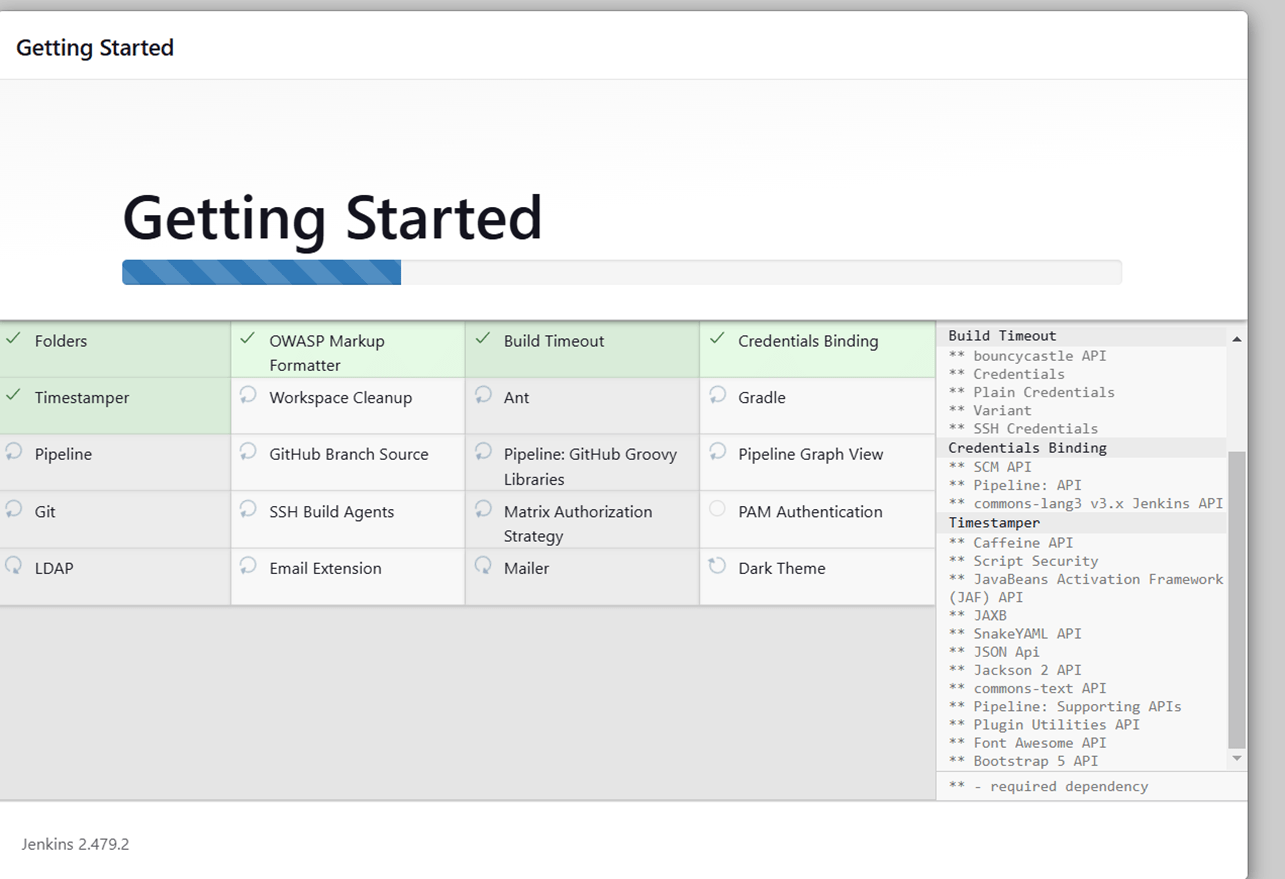
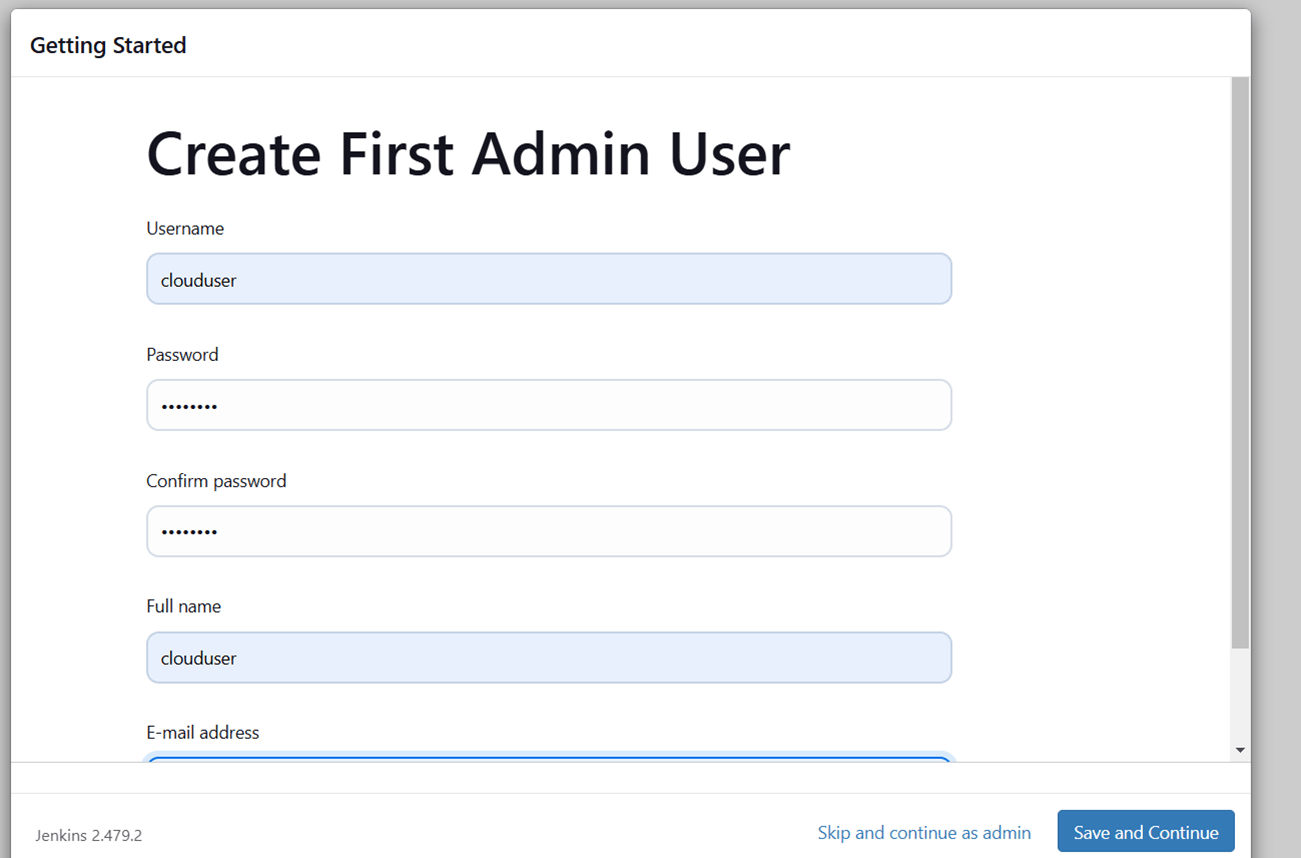
STEP 2: Create admin user.
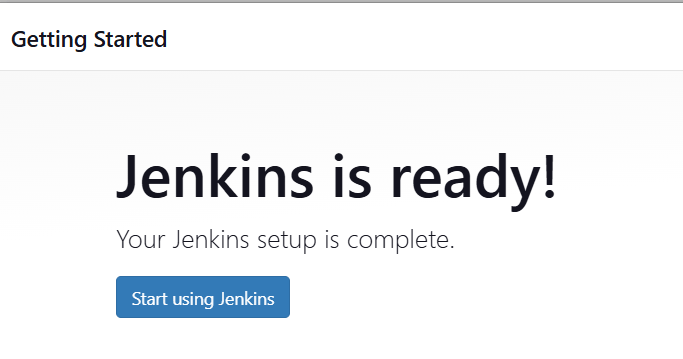
- Click save and continue and start using jenkins.
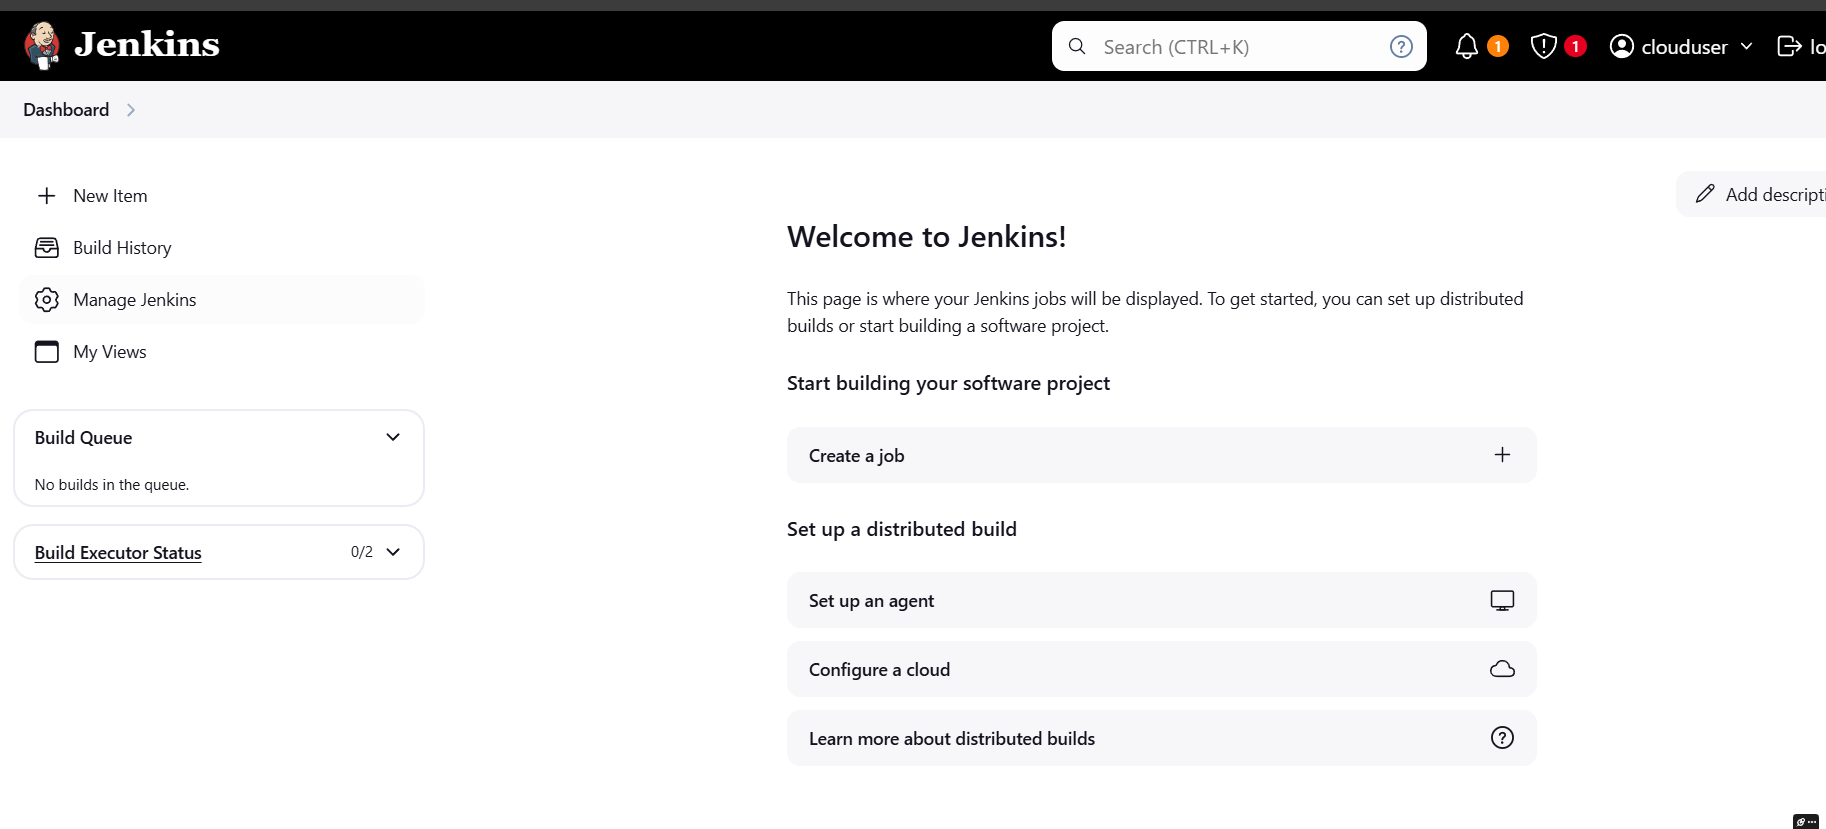
STEP 3: Next, You will see jenkins dashboard.
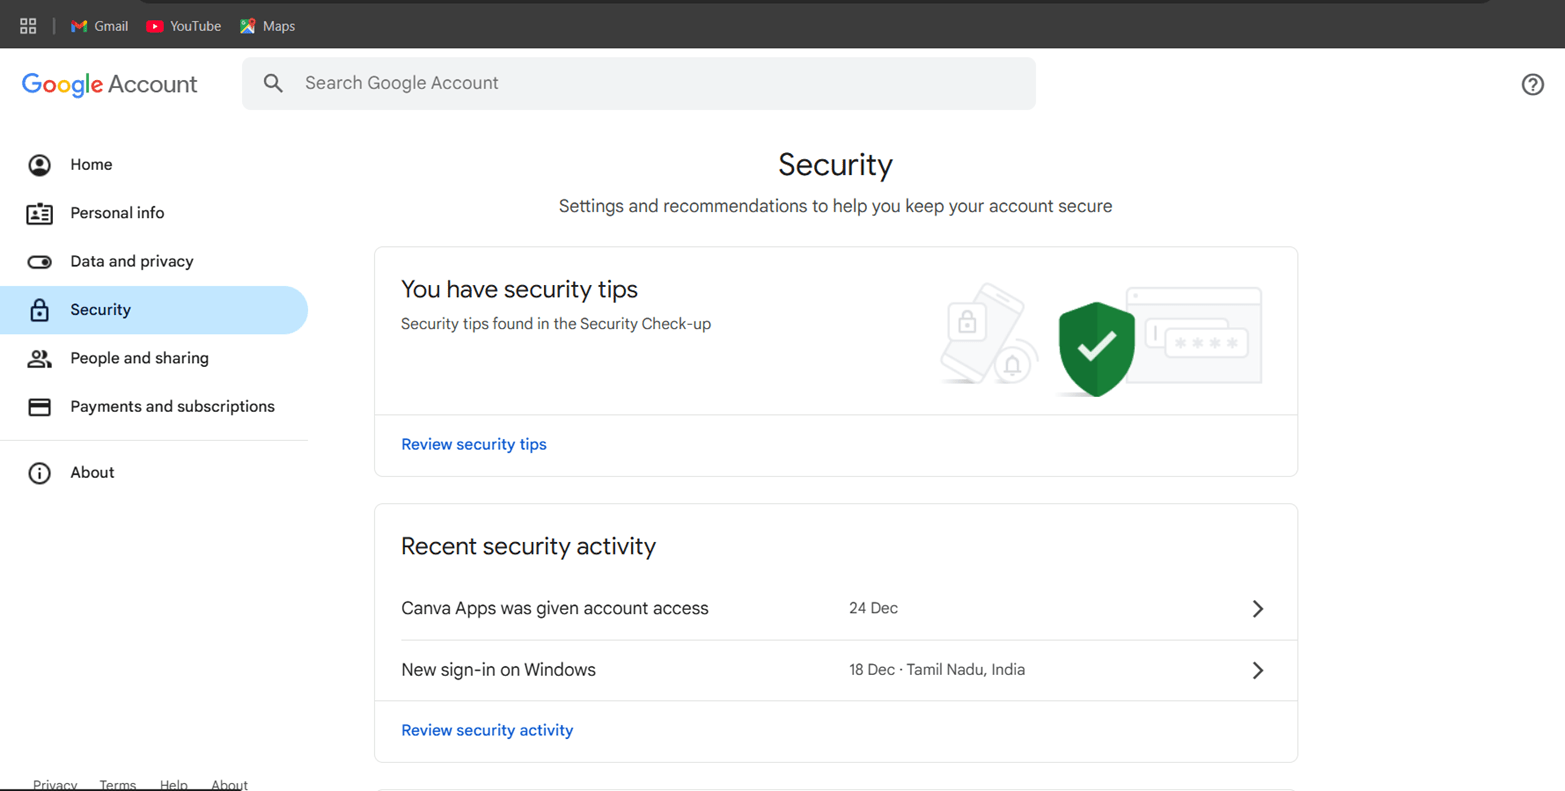
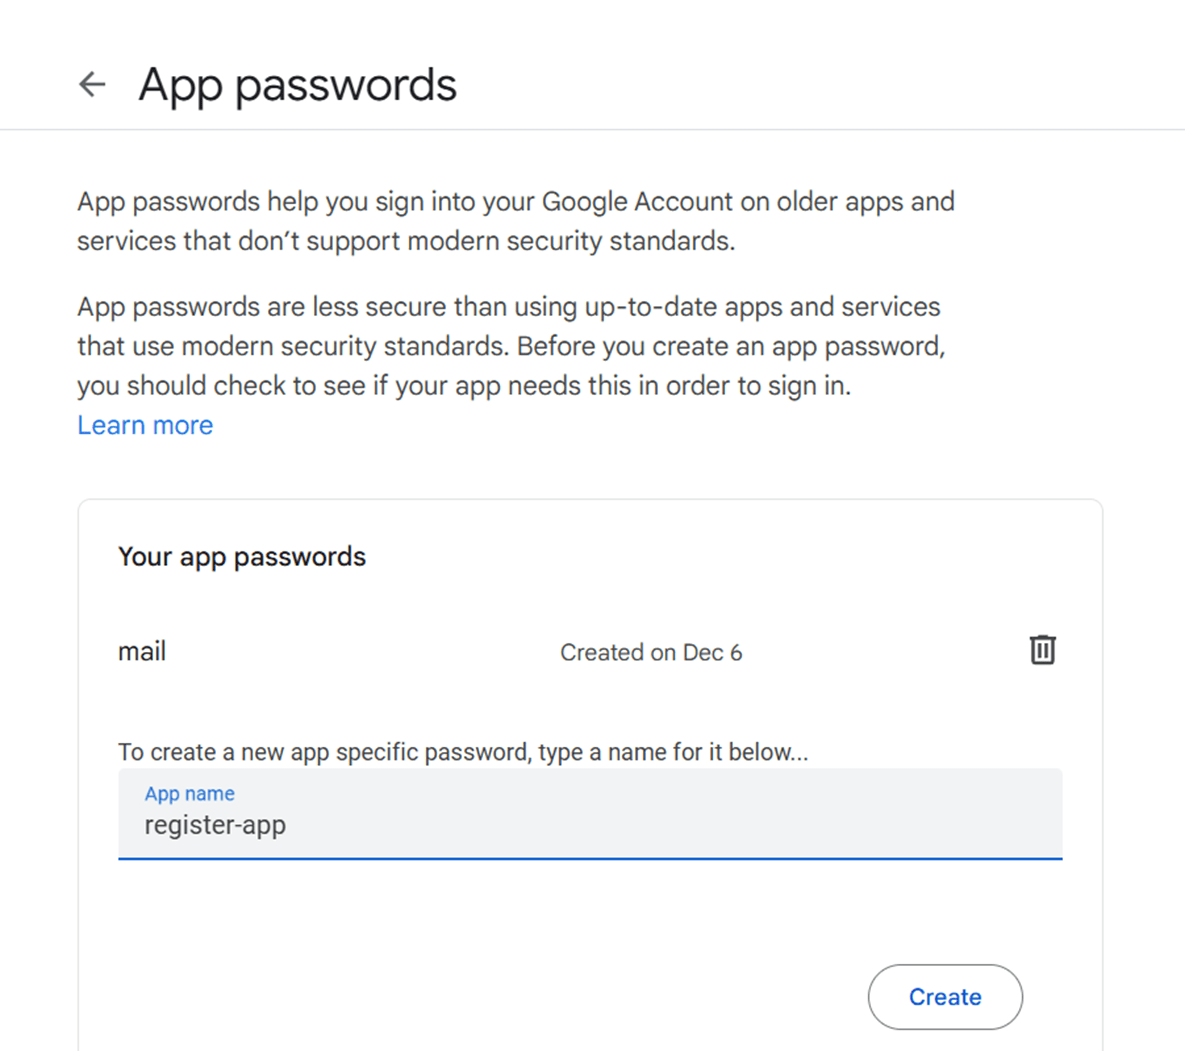
STEP 4: Go to google account and select security.
- Navigate the app password.
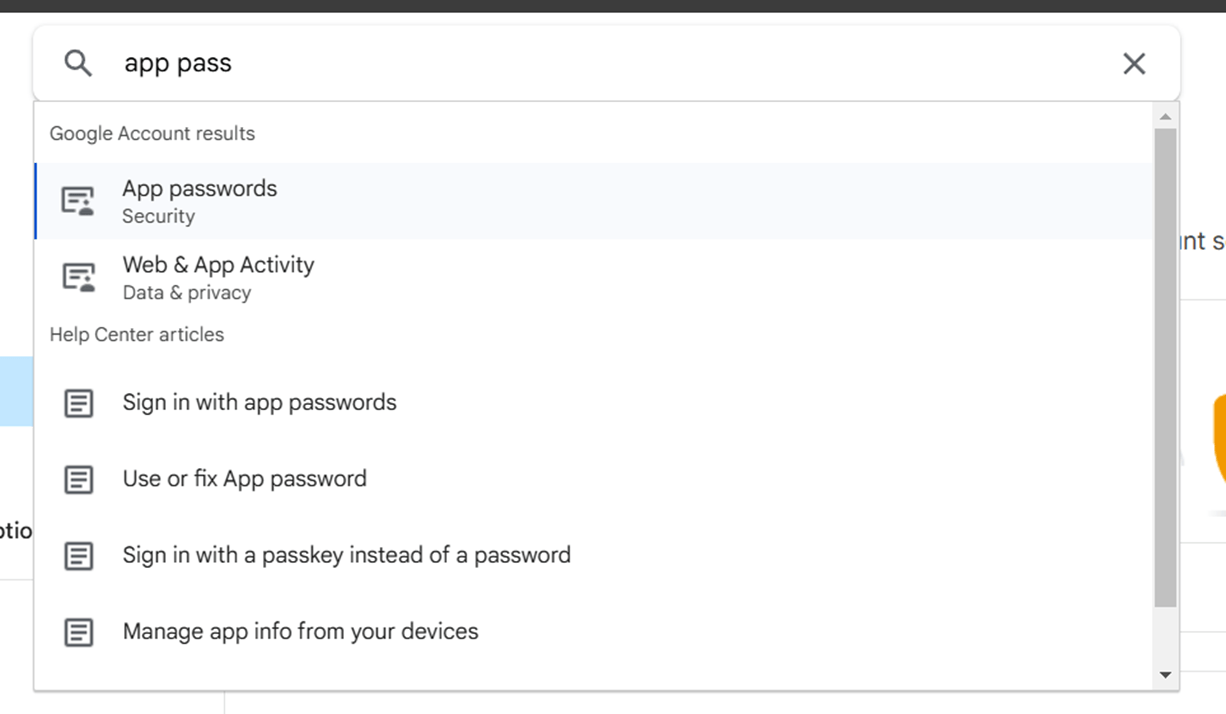
STEP 5: Create app password after you will get a secret password.
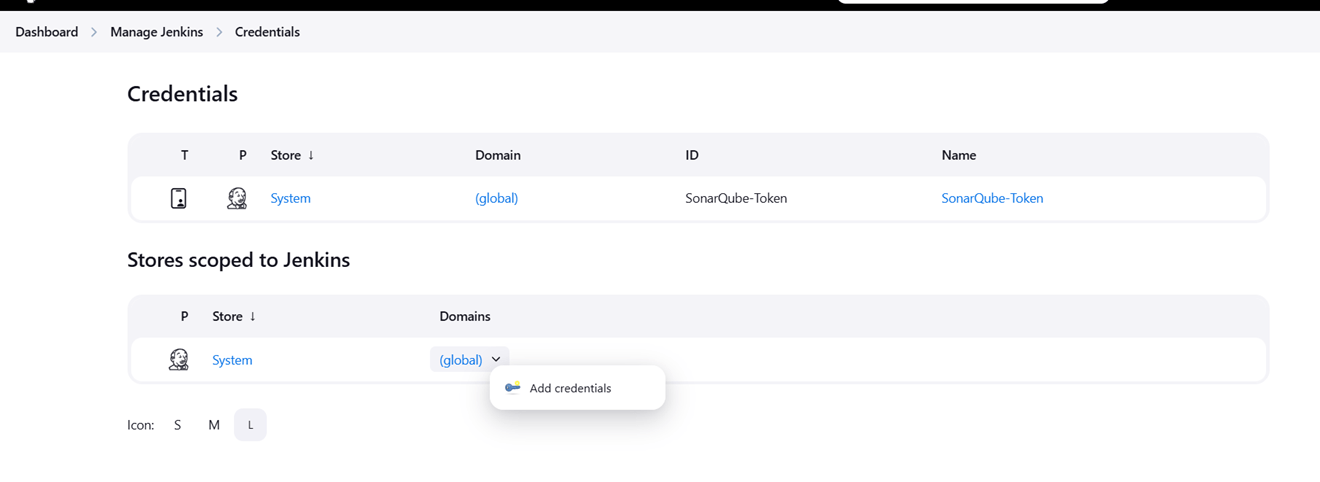
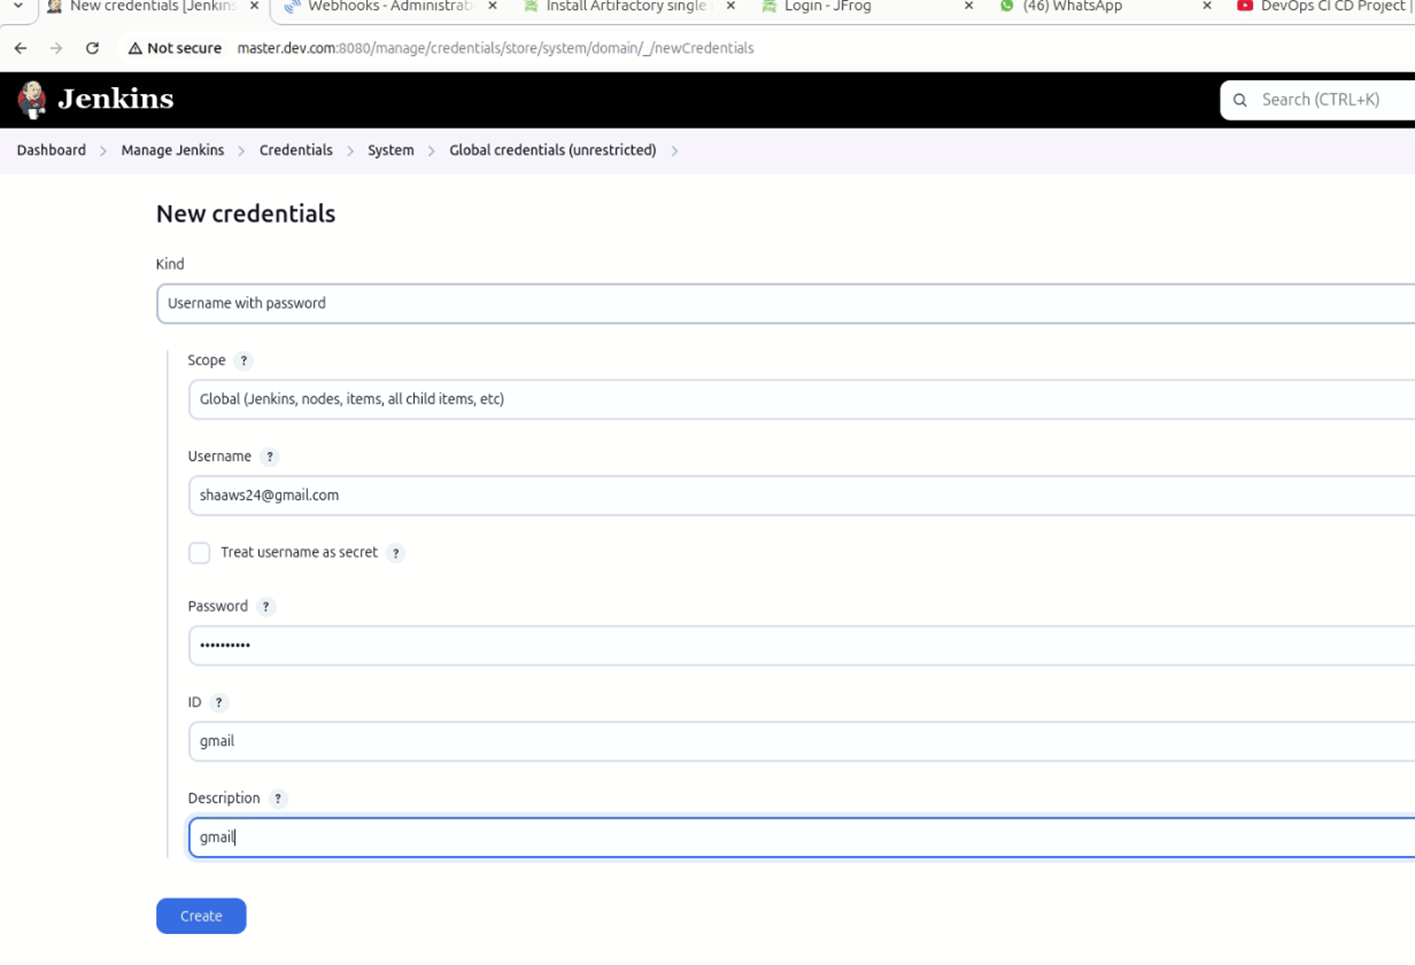
STEP 6: Go to manage jenkins, add credentials.
- Kind: Username with password.
- Username: Your email ID.
- Password: Secret password.
- ID: gmail.
- Click create.
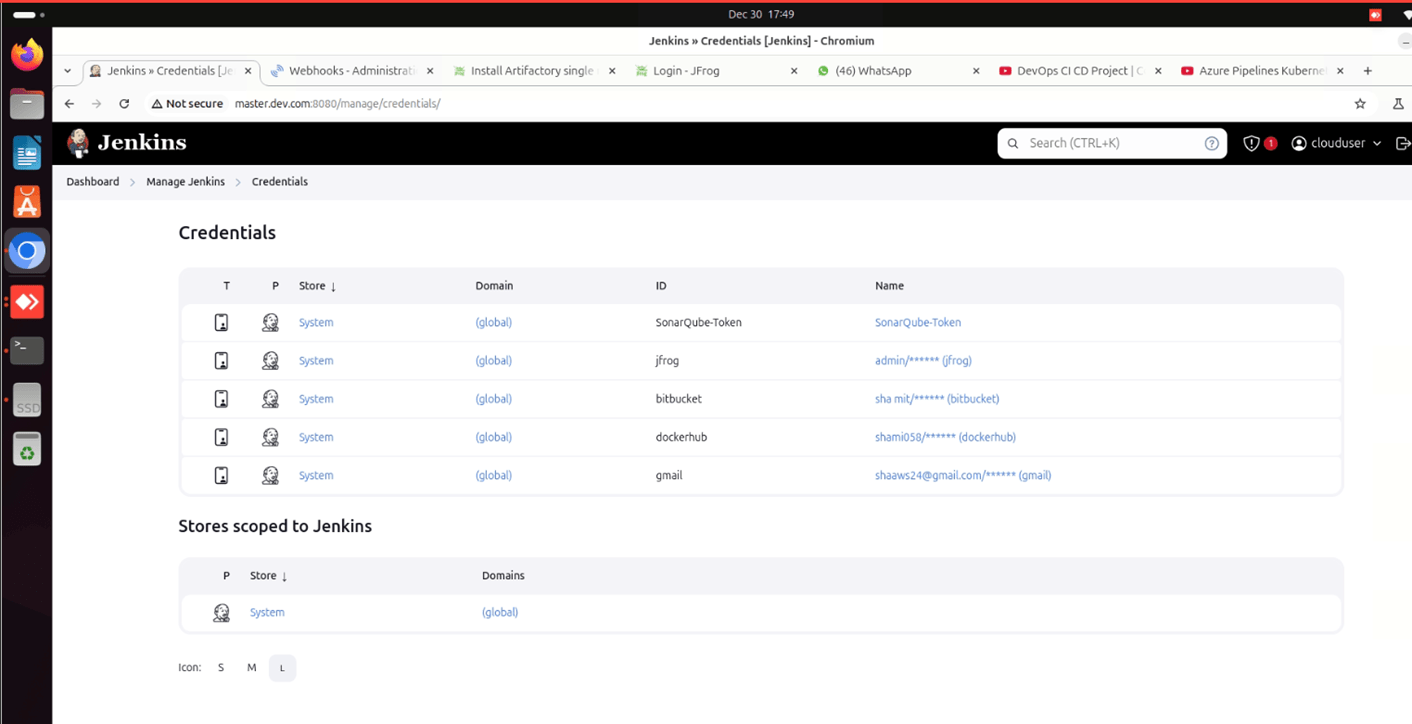
STEP 7: Manage jenkins select system.
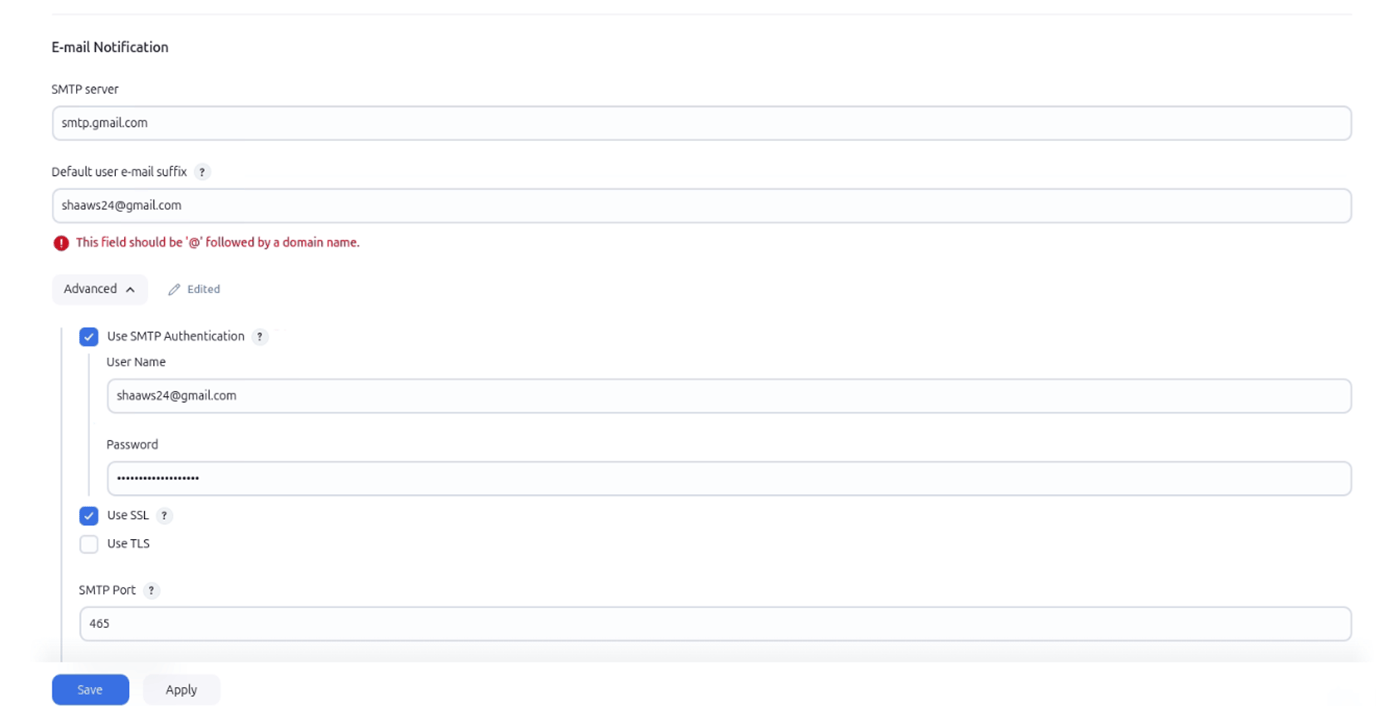
- Scroll down E-mail notification.
- SMTP Server: smtp.gmail.com
- Next Enter your email.
- Password: Secret password.
- Tick use SSL.
- Port: 465
- Click test configuration send email.
STEP 8: You will get a mail from jenkins.


Conclusion.
Jenkins notifications are an essential tool for teams using CI/CD processes, providing real-time feedback, improving communication, and ensuring fast detection and resolution of issues. By automating notifications, teams can focus on development and innovation while Jenkins handles the task of keeping everyone informed. This leads to a more efficient, transparent, and responsive software development lifecycle, contributing to higher software quality and faster delivery.
How to Install Apache Tomcat11(version 11.0.2) on ubuntu.
What is tomcat?
Apache Tomcat is a free, open-source web server and servlet container that’s used to host Java-based web applications. Apache Tomcat (called “Tomcat” for short) is a free and open-source implementation of the Jakarta Servlet, Jakarta Expression Language, and WebSocket technologies. It provides a “pure Java” HTTP web server environment in which Java code can also run.

How Does Tomcat Work?
Tomcat follows a modular architecture comprising connectors, containers, and the Catalina Servlet container. This architecture enables Tomcat to efficiently handle client requests and generate responses. Tomcat implements the Java Servlet and JavaServer Pages (JSP) specifications. It manages the lifecycle of servlets, loading and unloading them as needed.
Now, will create tomcat on ubuntu instance.
STEP 1:Create a EC2 instance (ubuntu machine).

STEP 2: Accessing instance with SSH.
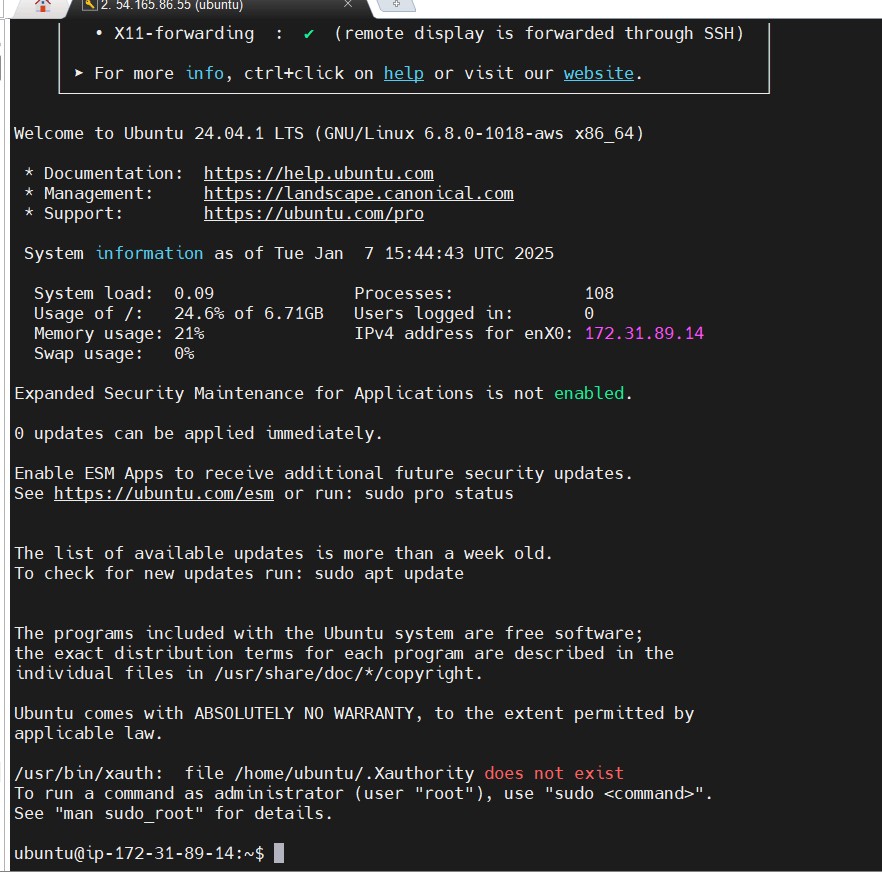
STEP 3: Install Java.
Tomcat requires Java to run. You’ll need at least JDK 11 for Tomcat 11. You can install OpenJDK using the following commands:
sudo apt update
sudo apt install openjdk-17-jdk -y
java -version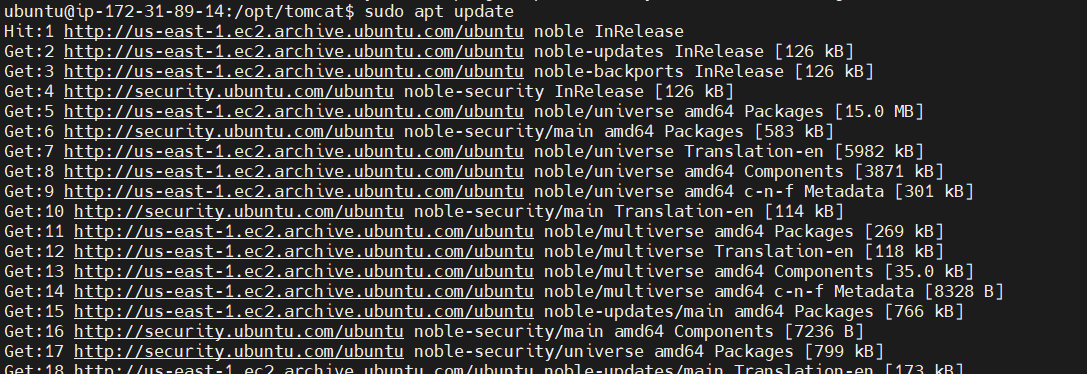


STEP 4: Create a directory named tomcat in the /opt folder.
sudo mkdir /opt/tomcat
cd /opt/tomcat
STEP 5: Download Apache Tomcat
Navigate to the /opt directory and download Tomcat 11.0.2 using wget.
Use the following link for tar.gz file. https://downloads.apache.org/tomcat/tomcat-11/v11.0.2/
https://dlcdn.apache.org/tomcat/tomcat-11/v11.0.2/bin/apache-tomcat-11.0.2.tar.gz
STEP 6: Extract the Tarball
Extract the downloaded tar.gz file.
<br>sudo tar -xvzf apache-tomcat-11.0.2.tar.gz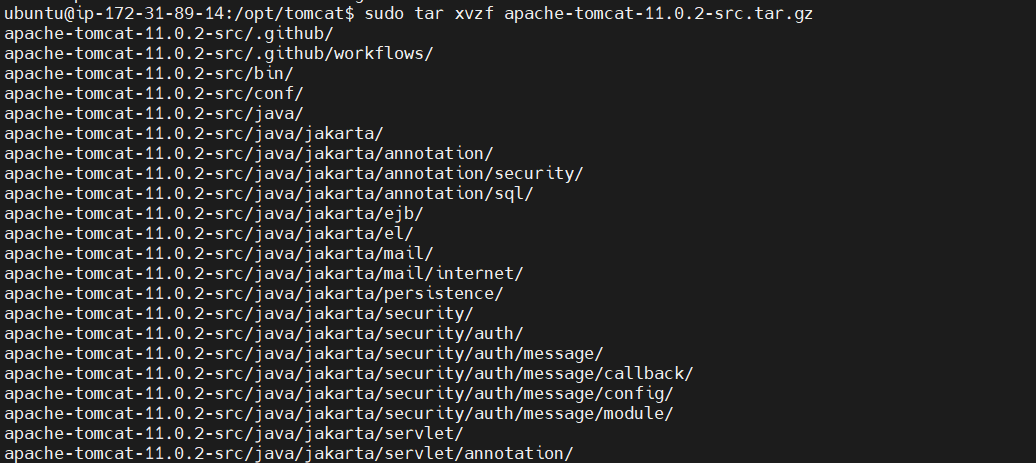
STEP 7: Rename the Tomcat Directory (Optional)
You may want to rename the Tomcat folder for easier access:
sudo mv apache-tomcat-11.0.2 tomcatSTEP 8: If you want Tomcat to start automatically on boot, you can create a systemd service file. Create a file named tomcat.service.
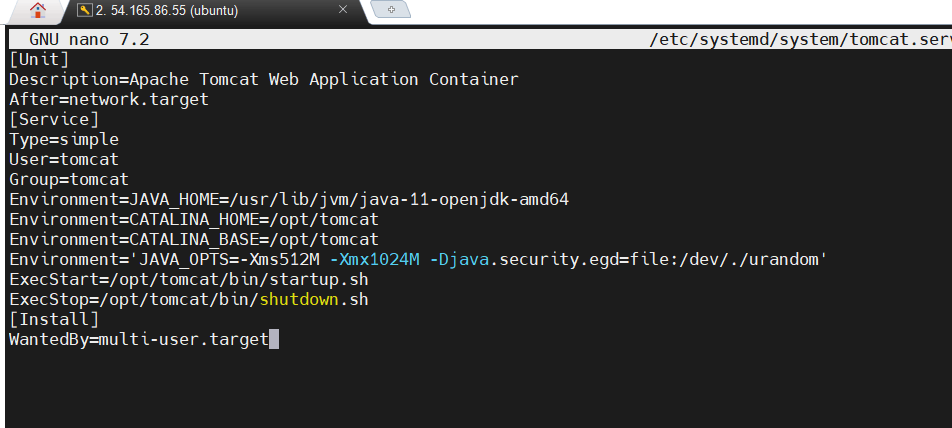
sudo nano /etc/systemd/system/tomcat.service
STEP 9: Add the following configuration (adjust paths and user accordingly).
ini
[Unit]
Description=Apache Tomcat Web Application Container
After=network.target
[Service]
Type=simple
User=username
Group=username
Environment=CATALINA_HOME=/opt/tomcat
Environment=JAVA_HOME=/usr/lib/jvm/java-17-openjdk-amd64
ExecStart=/opt/tomcat/bin/startup.sh
ExecStop=/opt/tomcat/bin/shutdown.sh
[Install]
WantedBy=multi-user.target
STEP 10: Start the tomcat server.
sudo systemctl daemon-reload
sudo systemctl enable tomcat
suto systemctl start tomcat
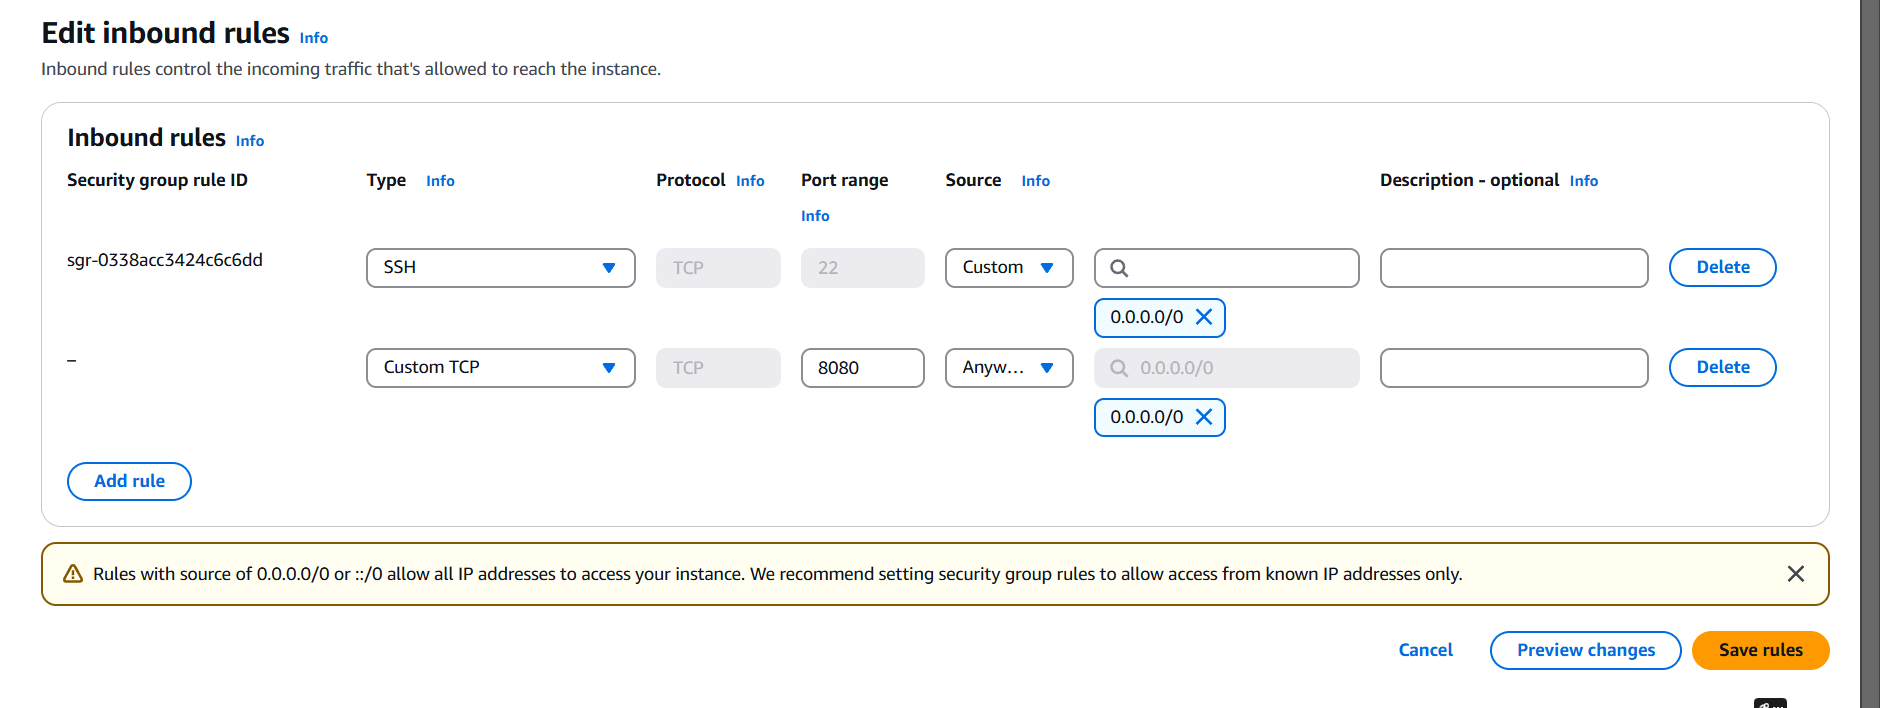
STEP 11: Go to instance and edit inbound rules.
Add the port number 8080 for tomcat.
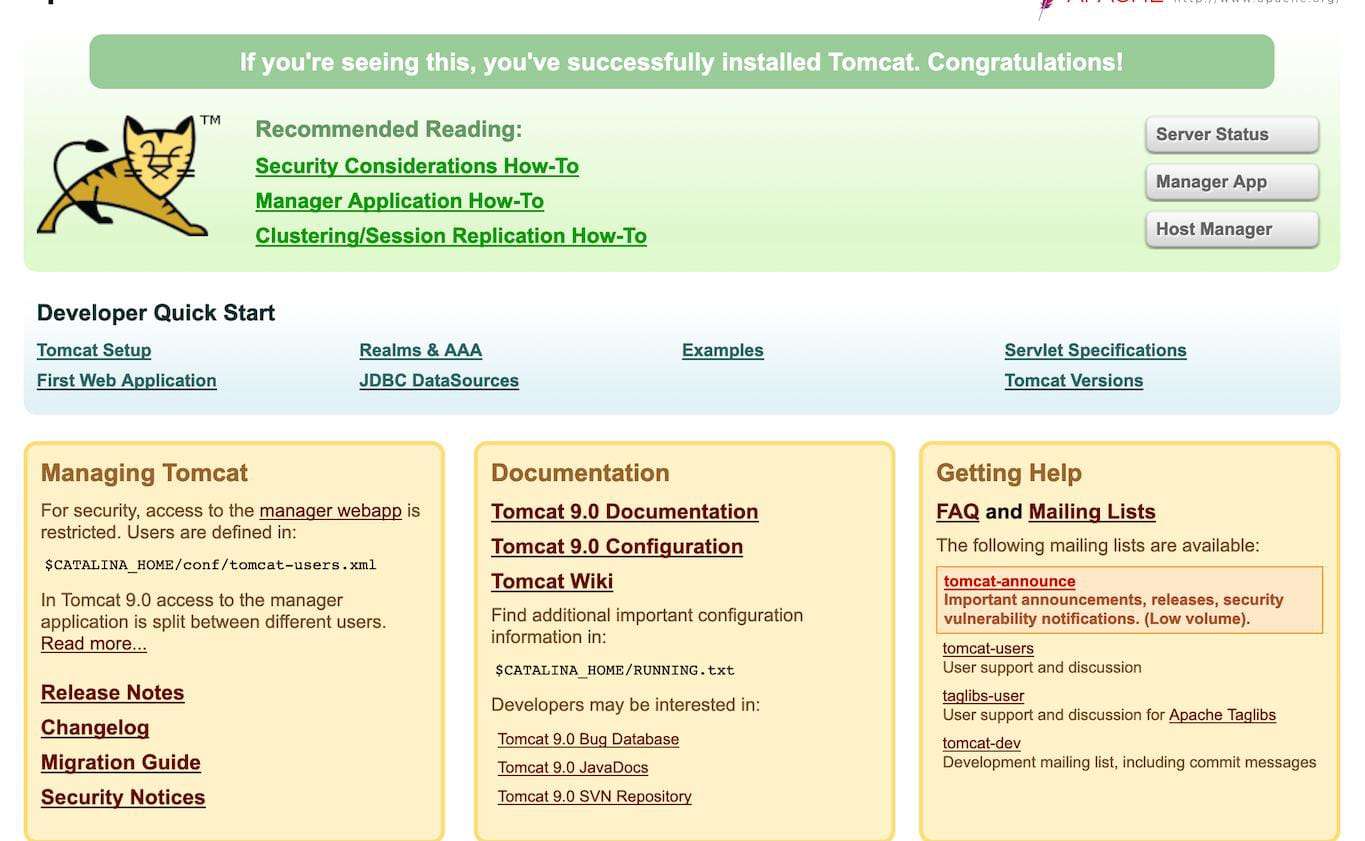
STEP 12: Go to your browser type http://<Public IP address>:8080
- You will see the tomcat dashboard.

Conclusion.
You have successfully installed Apache Tomcat 11.0.2 on Ubuntu! You can deploy your web applications to the webapps directory in the Tomcat installation directory. Nowadays, Apache Tomcat is widely used by many companies as it implements many of the Jakarta EE specifications, such as: Java Servlet. JavaServer Pages. Java Expression Language.
Installing Prometheus & Grafana on Ubuntu: Easy Setup Tutorial.
What is Prometheus?
Prometheus is a metrics-based monitoring system and time-series database (TSDB) designed to collect and store metrics data over time. It allows teams to monitor the health and performance of applications, systems, and infrastructure components, especially in microservices and containerized environments.
Prometheus was originally developed by SoundCloud and is now a part of the Cloud Native Computing Foundation (CNCF), the same organization that maintains Kubernetes.

What is Grafana?
Grafana is primarily used to visualize time-series data, which makes it an ideal tool for monitoring and observability in DevOps. It integrates with a variety of data sources, including Prometheus, Elasticsearch, InfluxDB, MySQL, PostgreSQL, Graphite, and more.
Next, I will proceed with the installation of Prometheus and Grafana.
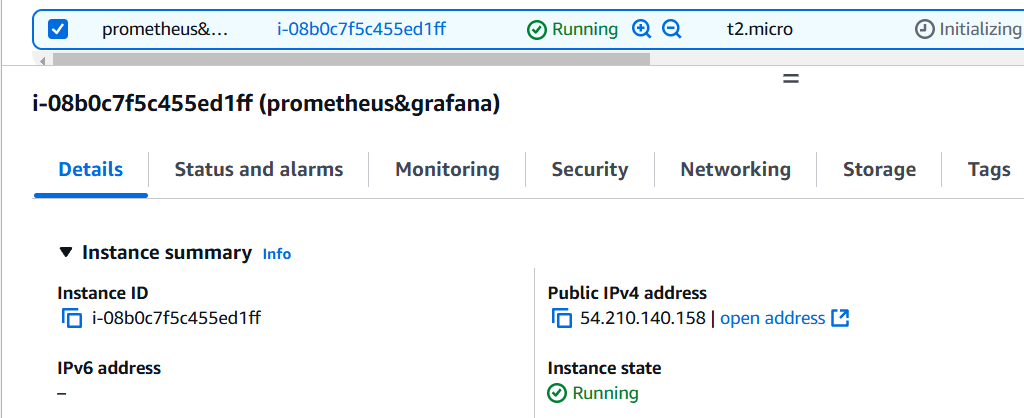
TASK 1: Accessing EC2 instance with ssh.
STEP 1: Create a instance (ubuntu)
- Access the instance with ssh.
STEP 2: Create a System User for Prometheus.
sudo apt-get update
sudo useradd --system --no-create-home --shell /bin/false prometheus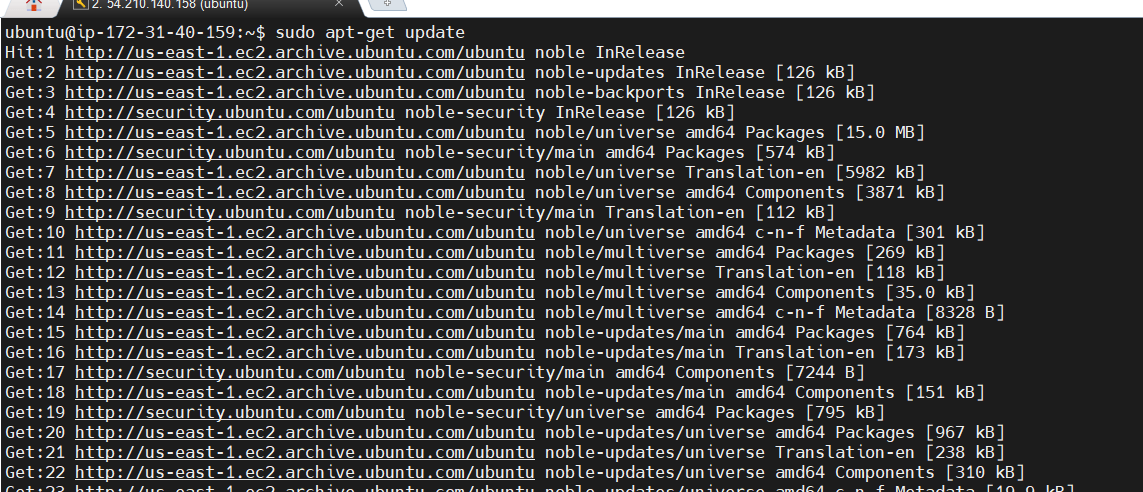
STEP 3: Download the tar.gz file.
wget https://github.com/prometheus/prometheus/releases/download/v2.51.2/prometheus-2.51.2.linux-amd64.tar.gz
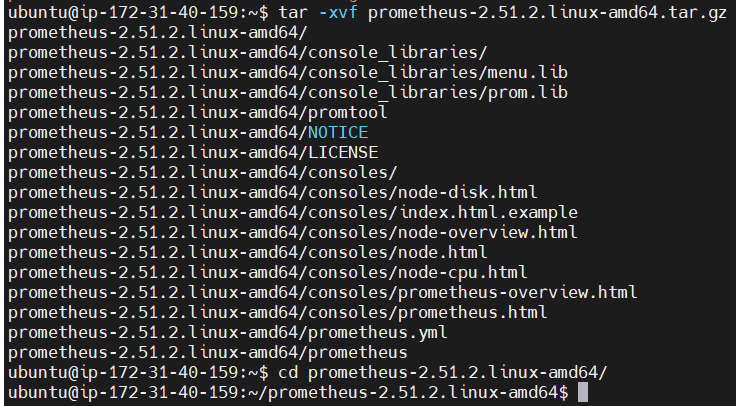
tar -xvf prometheus-2.51.2.linux-amd64.tar.gz
cd prometheus-2.51.2.linux-amd64/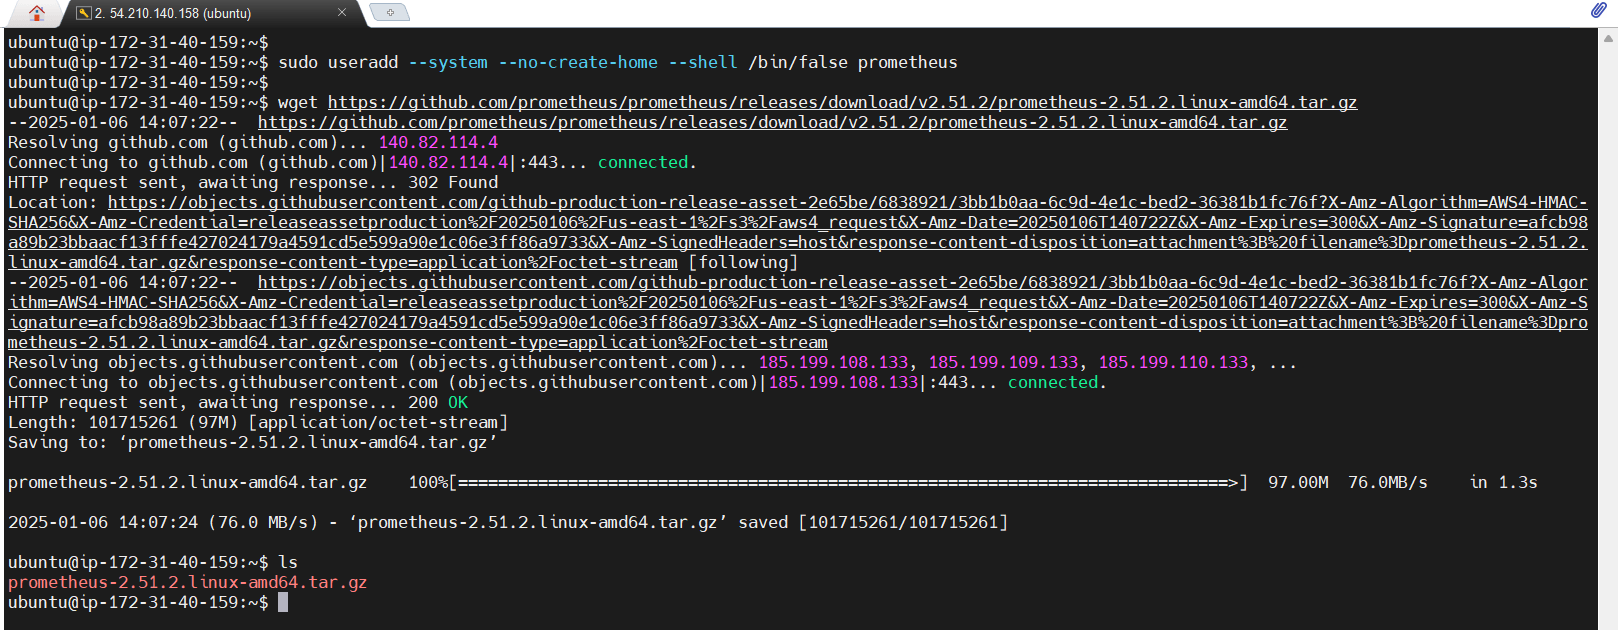
STEP 4: Create a data folder at the root directory, with a prometheus folder inside.
sudo mkdir -p /data /etc/prometheus
sudo mv prometheus promtool /usr/local/bin/
sudo mv consoles/ console_libraries/ /etc/prometheus/
sudo mv prometheus.yml /etc/prometheus/prometheus.yml
sudo chown -R prometheus:prometheus /etc/prometheus/ /data/
STEP 5: Configuring Prometheus as a service.
cd /etc/systemd/system/
sudo touch prometheus.service
sudo nano prometheus.service
STEP 6: Copy and paste the file.
- Save the file.
[Unit]
Description=Prometheus
Wants=network-online.target
After=network-online.target

StartLimitIntervalSec=500
StartLimitBurst=5

[Service]
User=prometheus
Group=prometheus
Type=simple
Restart=on-failure
RestartSec=5s
ExecStart=/usr/local/bin/prometheus \
  --config.file=/etc/prometheus/prometheus.yml \
  --storage.tsdb.path=/data \
  --web.console.templates=/etc/prometheus/consoles \
  --web.console.libraries=/etc/prometheus/console_libraries \
  --web.listen-address=0.0.0.0:9090 \
  --web.enable-lifecycle

[Install]
WantedBy=multi-user.target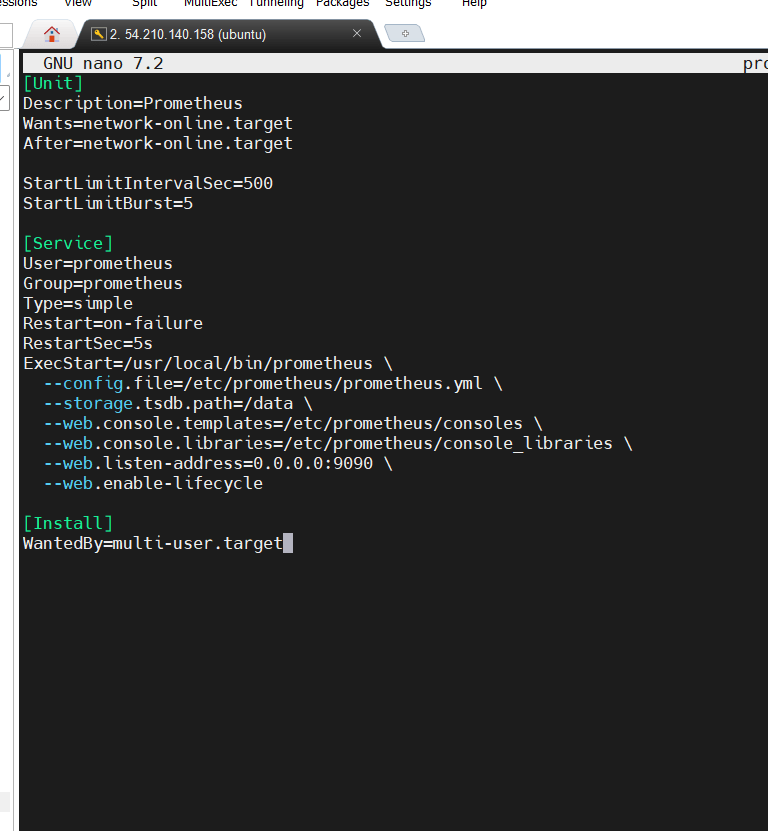
STEP 7: Enable and Start the prometheus.
sudo systemctl enable prometheus
sudo systemctl start prometheus
sudo systemctl status prometheus
STEP 8: Next, go to the instance, Add the security group.
- 9090 for prometheus.
- 3000 for grafana.
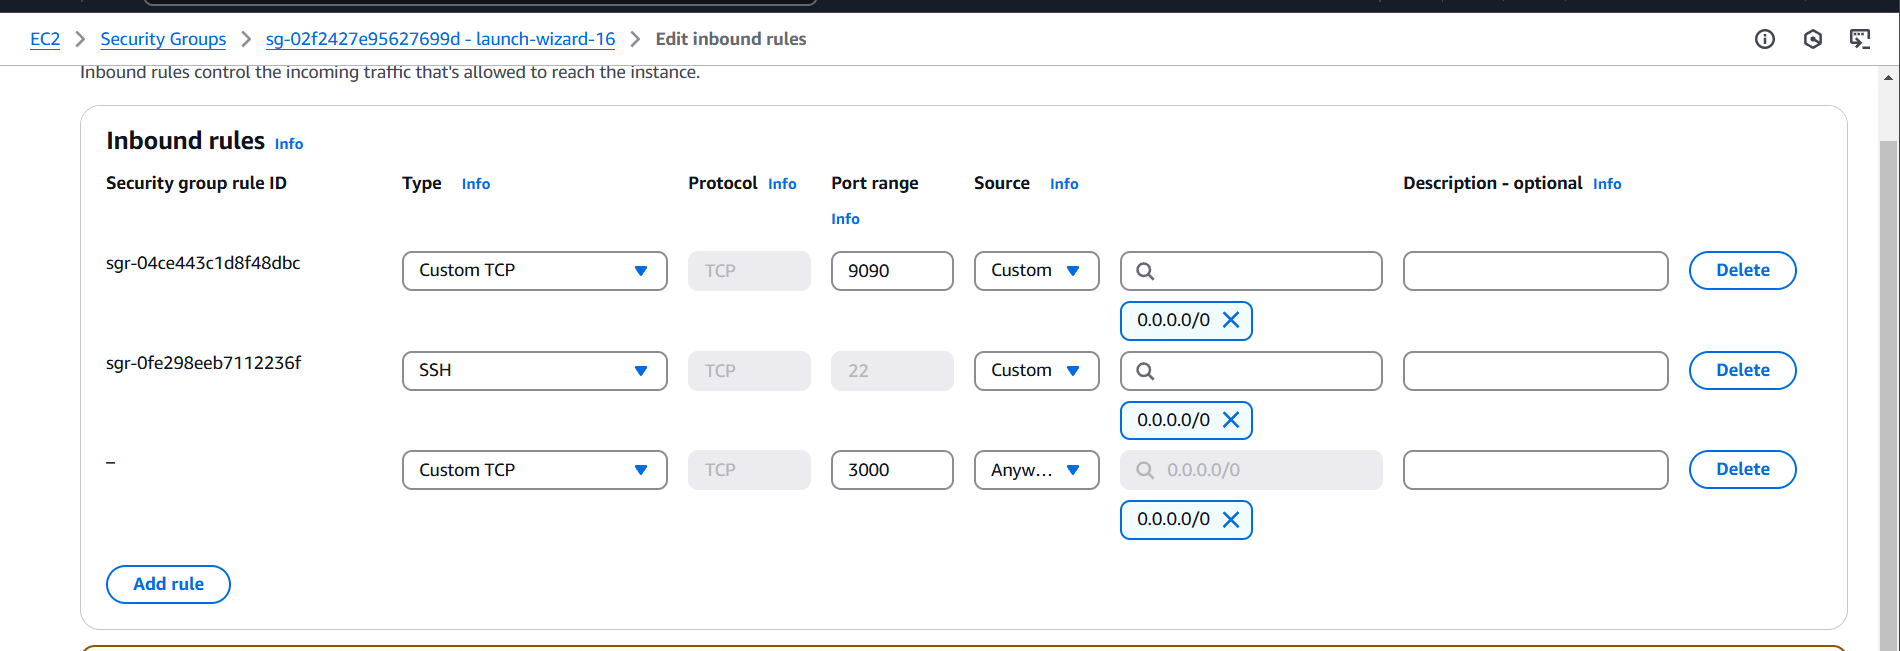
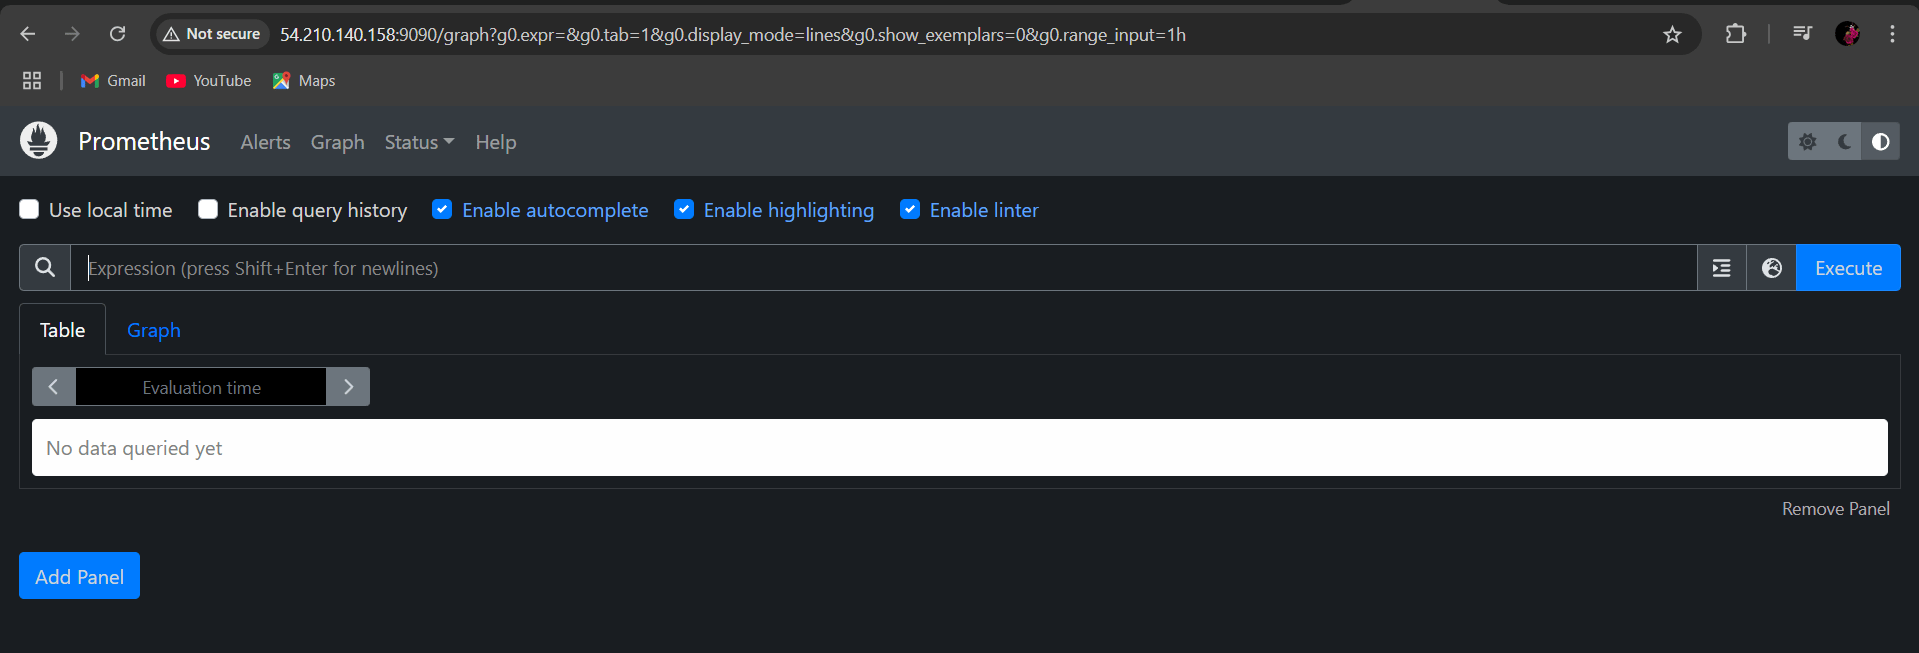
STEP 9: Go to browser type http://<your IP address>:9090/
- You will see prometheus dashboard.
TASK 2: Install Grafana.
STEP 1: Install grafana use the following command.
sudo apt-get install -y apt-transport-https software-properties-common
wget -q -O - https://packages.grafana.com/gpg.key | sudo apt-key add -
echo "deb https://packages.grafana.com/oss/deb stable main" | sudo tee -a /etc/apt/sources.list.d/grafana.list
sudo apt-get update
sudo apt-get -y install grafana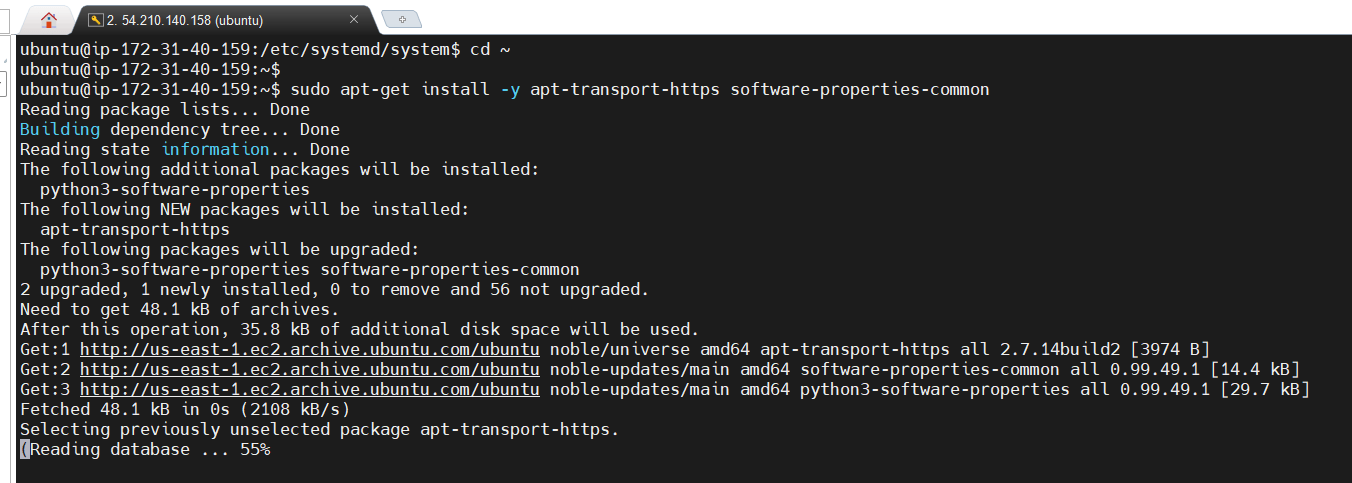


STEP 2: Enable and start the grafana server.
sudo systemctl enable grafana-server
sudo systemctl start grafana-server
sudo systemctl status grafana-server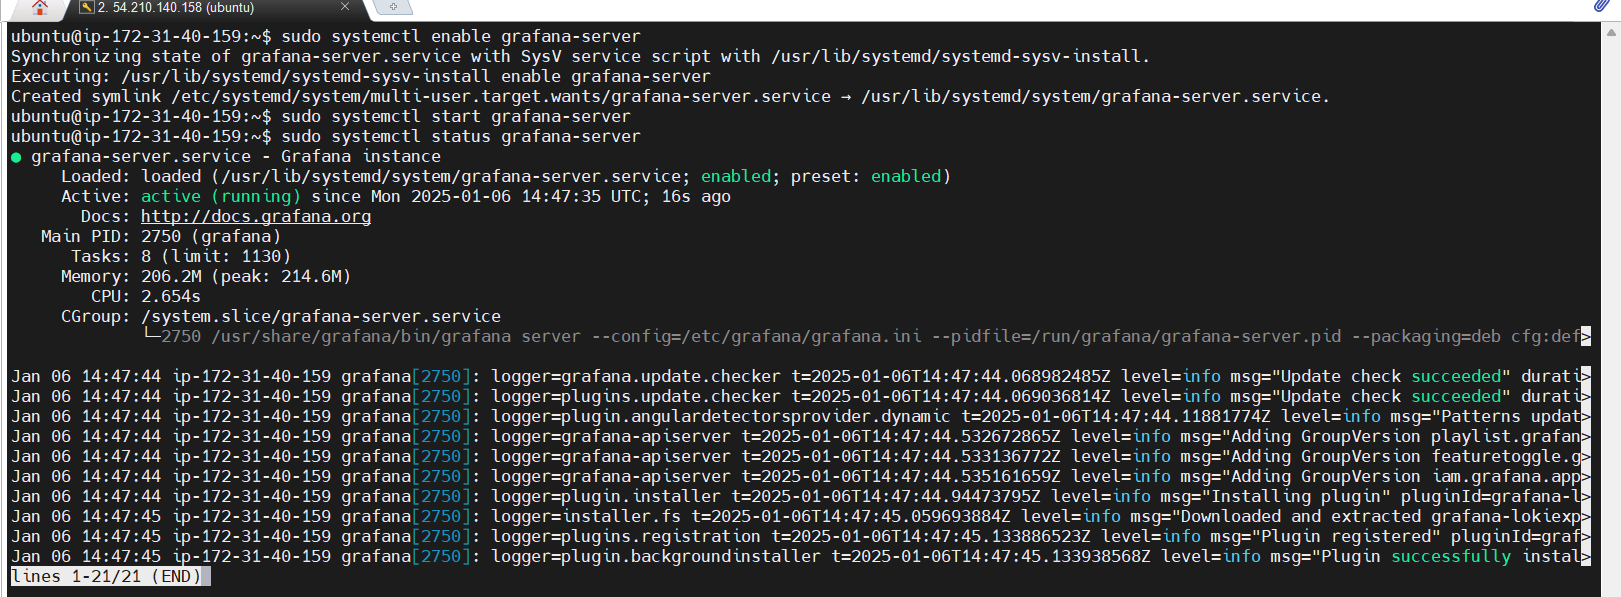
STEP 3: Type your browser http://<your IP address>:3000
- Enter the username: admin
- Password: admin
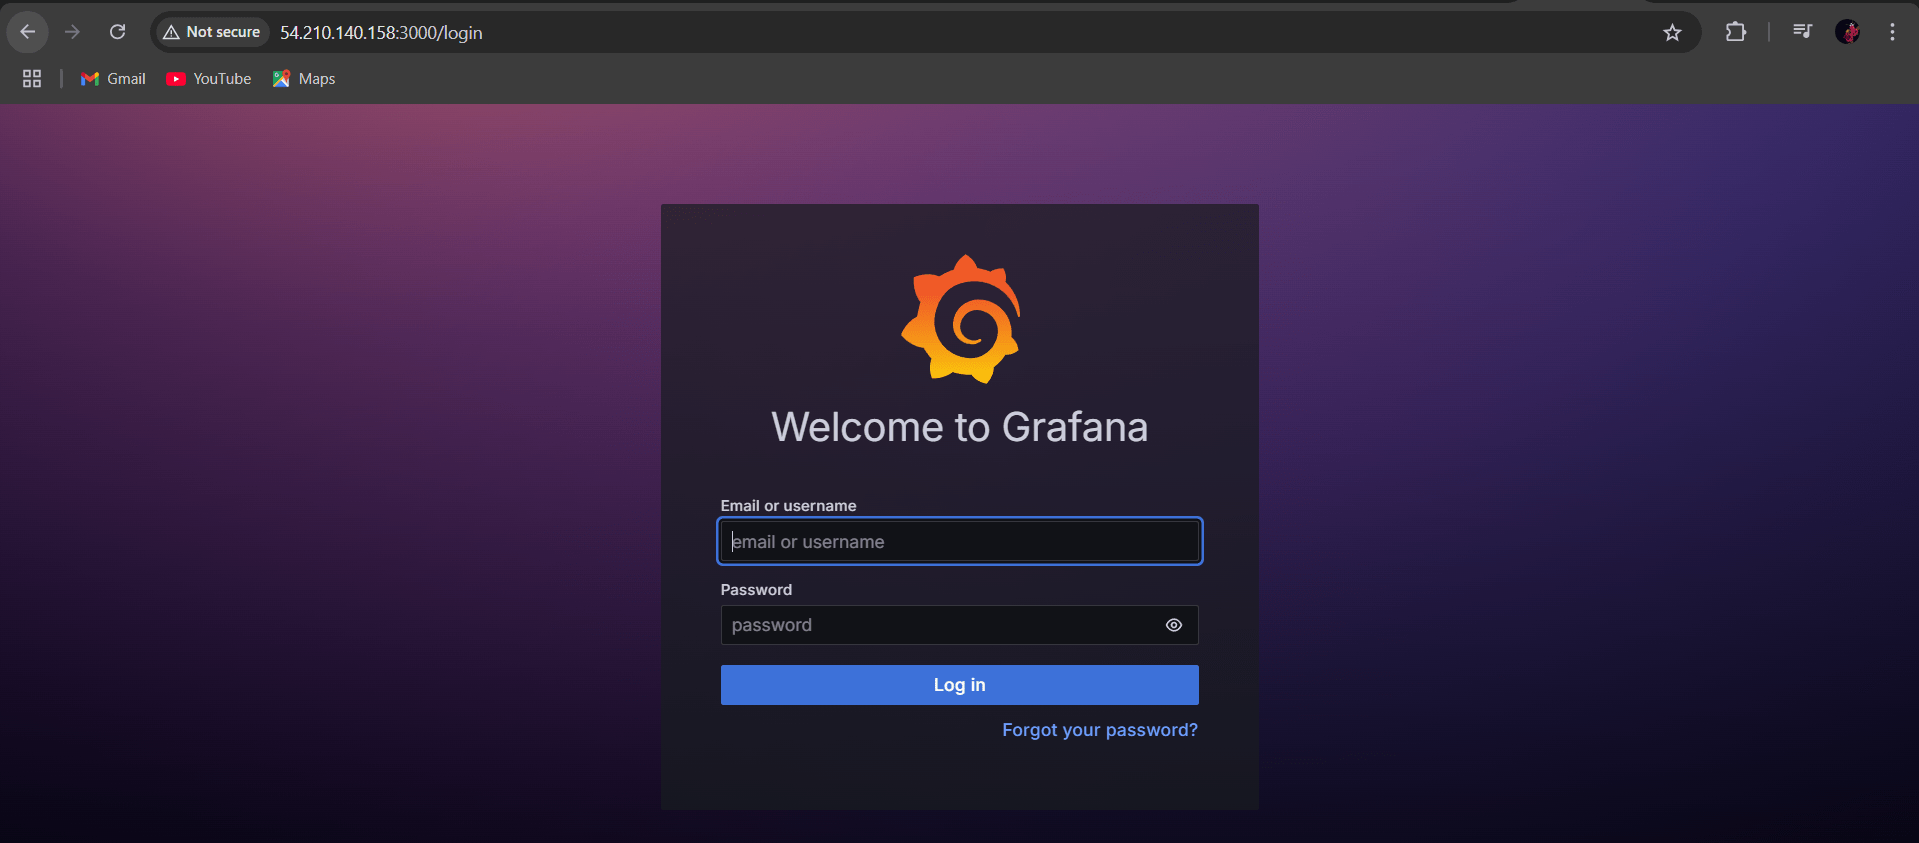
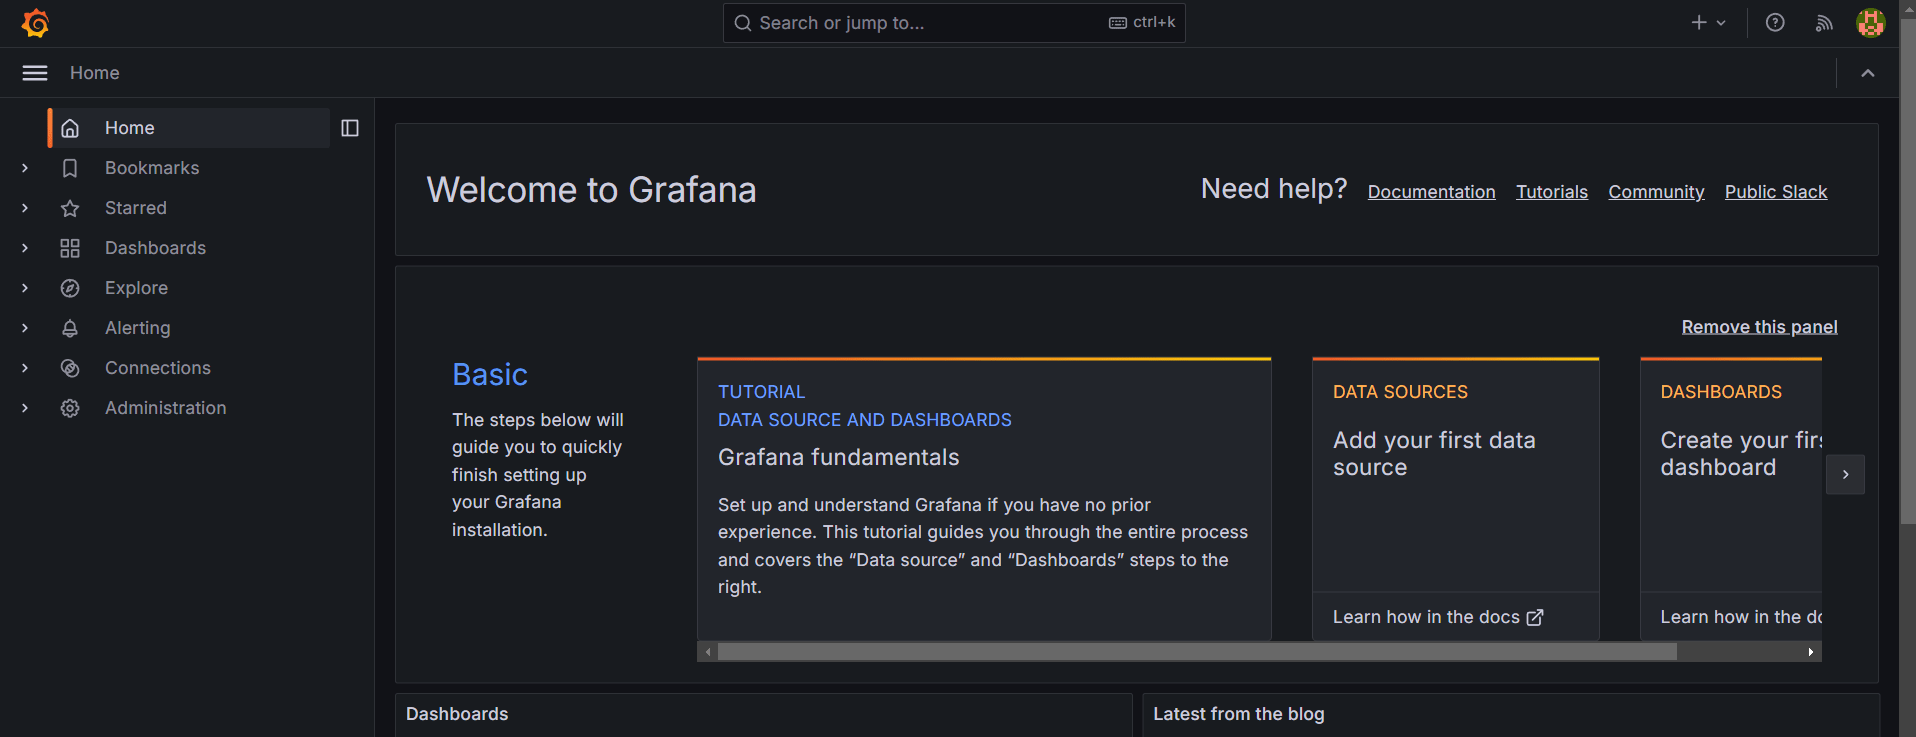
STEP 4: You will see grafana dashboard.
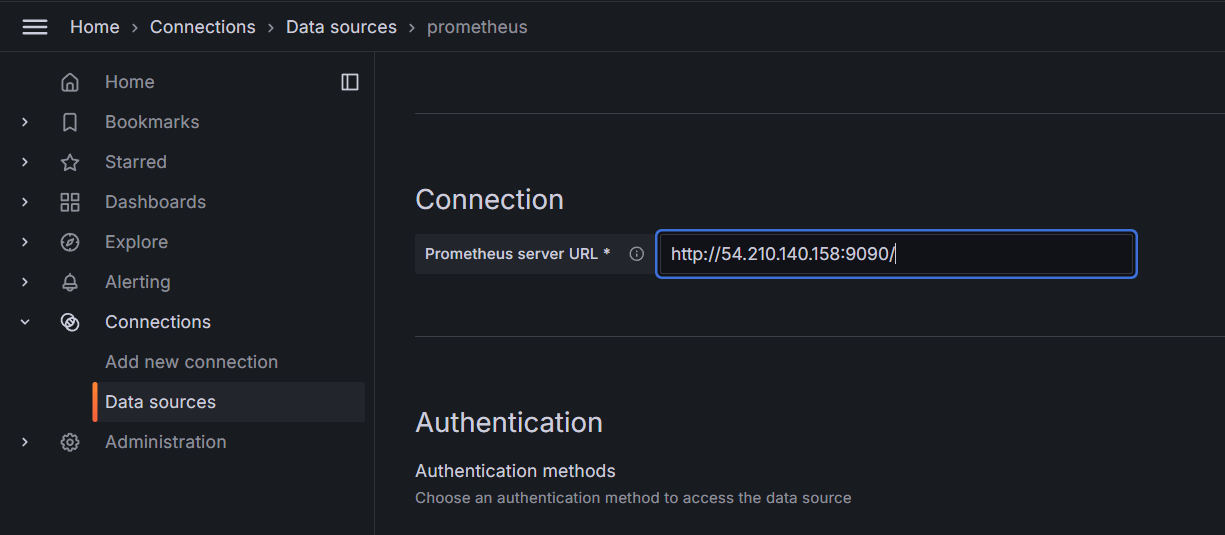
STEP 5: Click data sources select prometheus and enter the prometheus url.
- Click on save and test it.



Conclusion.
In this guide, we’ve walked through the essential steps for installing and configuring Prometheus and Grafana, two of the most powerful and popular tools in modern DevOps and cloud-native monitoring. Prometheus, with its robust time-series data collection and querying capabilities, allows you to monitor system health, performance, and operational metrics with precision. On the other hand, Grafana empowers you to visualize that data in beautiful, interactive dashboards that facilitate real-time insights and effective decision-making.
In the end, monitoring and observability are not just about preventing issues—they’re about empowering your team with the data they need to optimize and improve the performance of your systems continuously. Happy monitoring!
Using Terraform to Automate Your AWS S3 Bucket Setup.
Terraform.
Terraform is an open-source Infrastructure as Code (IaC) tool developed by HashiCorp, that lets you build, change, and version cloud and on-prem resources safely and efficiently in human-readable configuration files that you can version, reuse, and share.

Amazon S3.
Amazon Web Services (AWS) S3 (Simple Storage Service) is a scalable, high-performance cloud storage service that allows businesses and developers to store and retrieve data from anywhere on the web. It is probably the most commonly used, go-to storage service for AWS users given the features like extremely high availability, security, and simple connection to other AWS Services. Includes features like versioning, lifecycle management, and replication (cross-region or same-region replication). S3 is designed for 99.999999999% (11 9s) of durability, meaning your data is safe and highly available.
In this article, I will walk you through the process of launching an Amazon S3 bucket using a Terraform script, with Visual Studio Code (VSCode) as the code editor.
Prerequisite:
- AWS Account
- Terraform Installation
- AWS CLI
TASK1 : Create IAM user.
Step 1: Navigate the IAM and click on User .
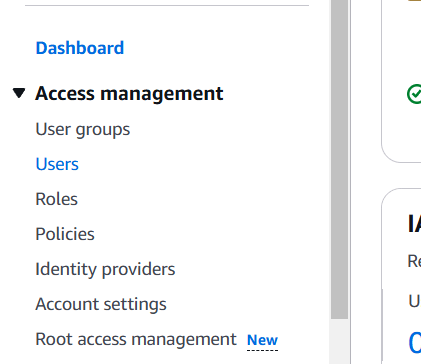
STEP 2: Click on create user.

STEP 3: Enter the user name and click on next button.

STEP 4: Select attach policies directly.
- Tick on amazons3full access.
- Then, next click on next button.
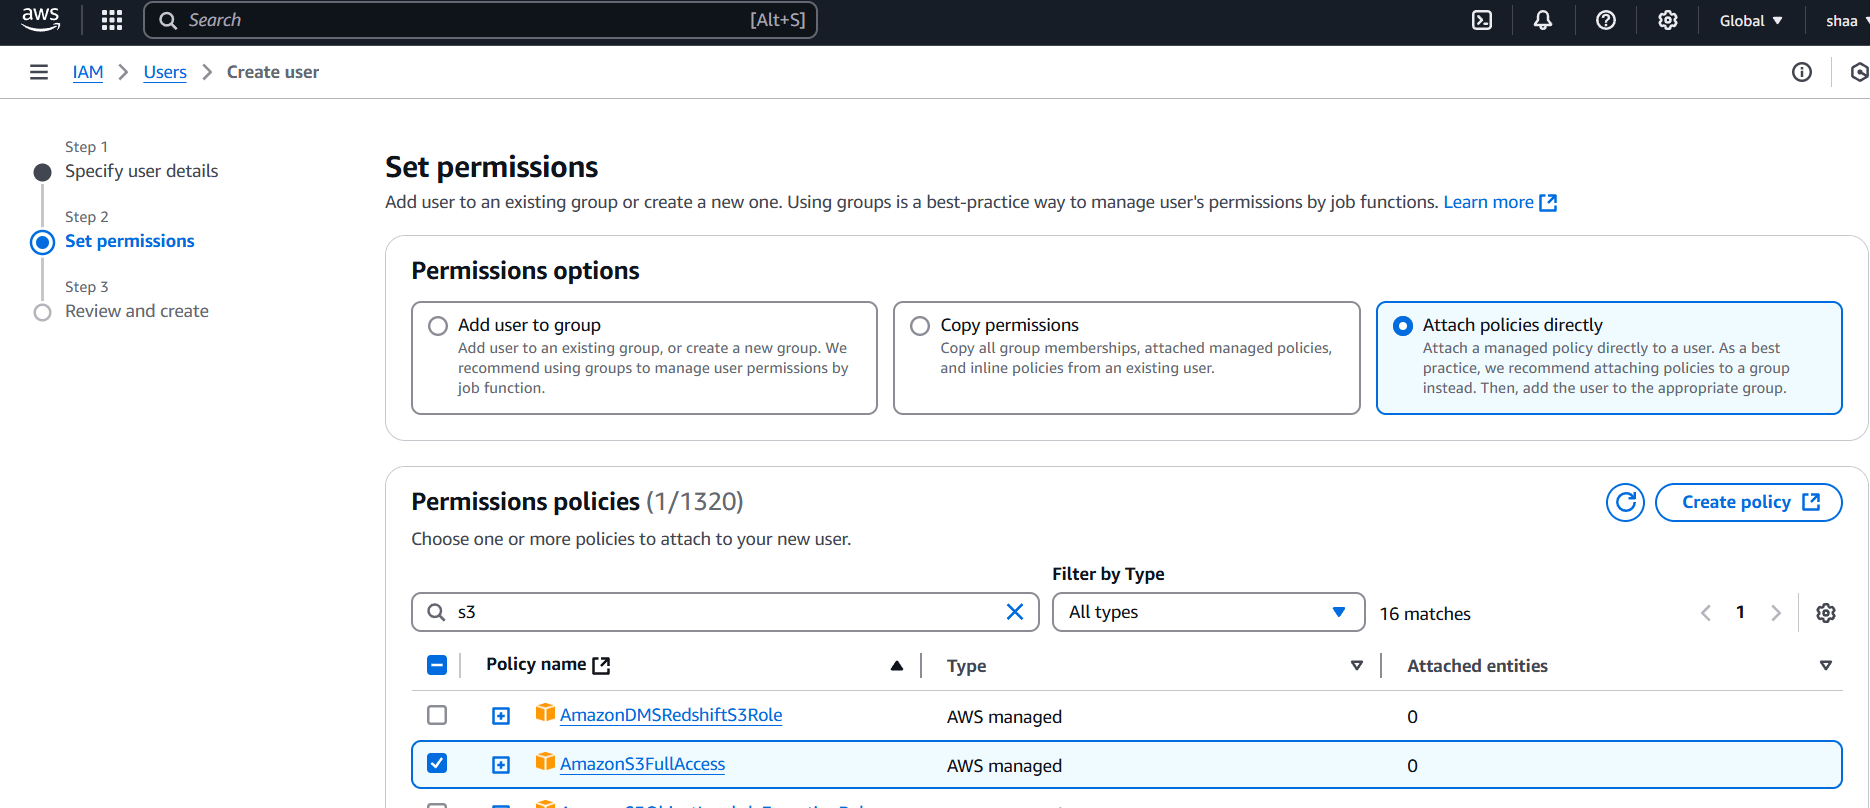
STEP 5: Click on create user.
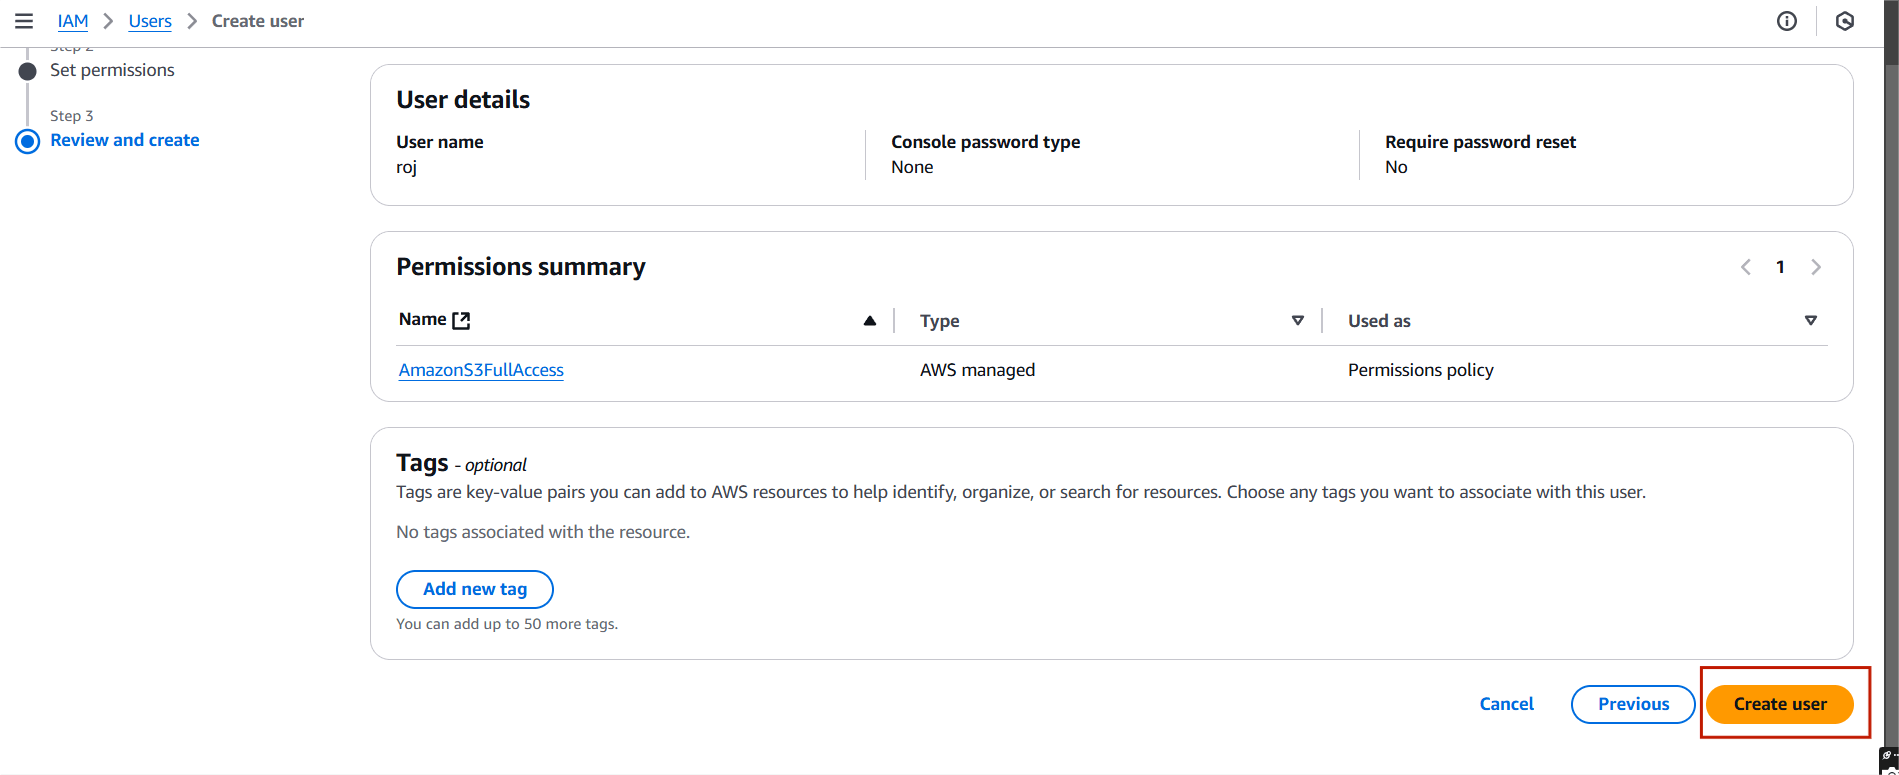
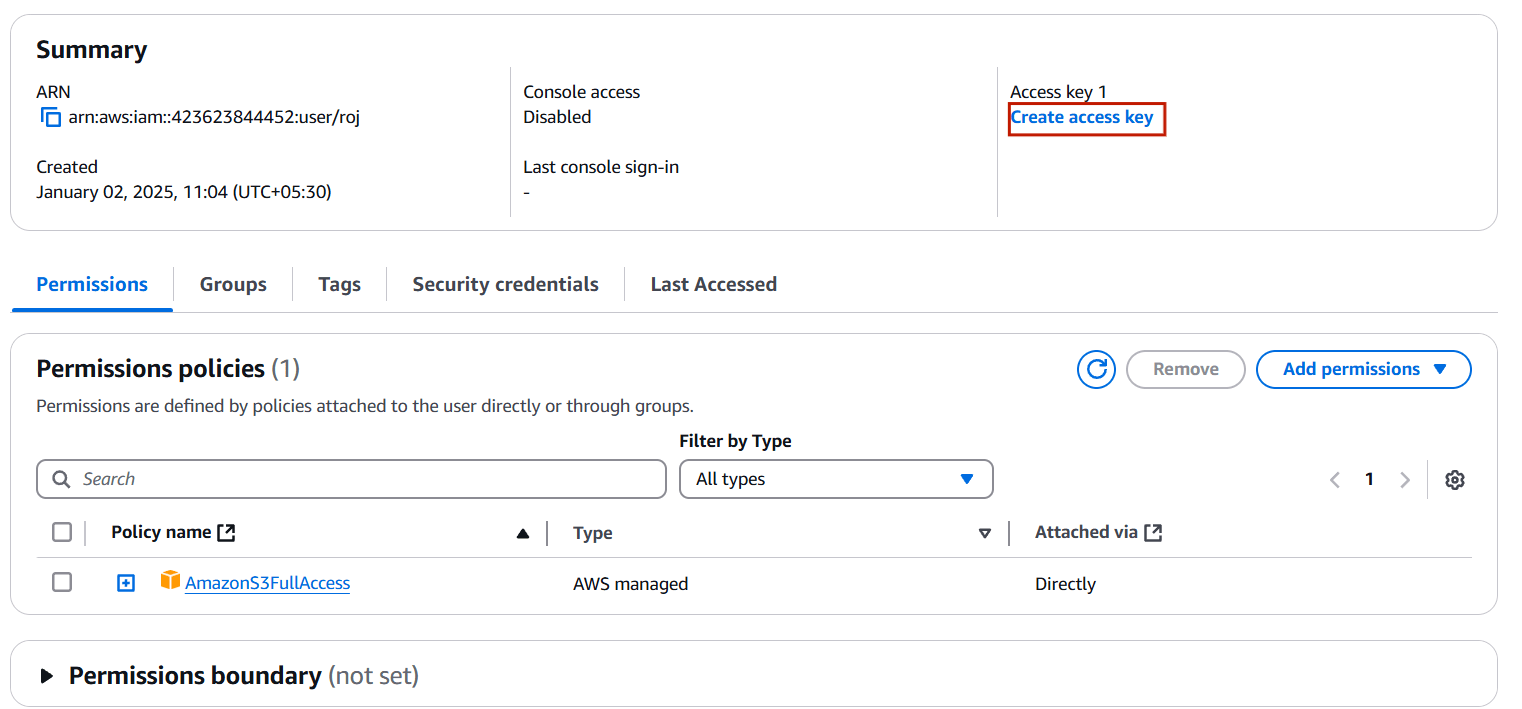
TASK 2: Create access key.
STEP 1: Click your user name and select on create access key.
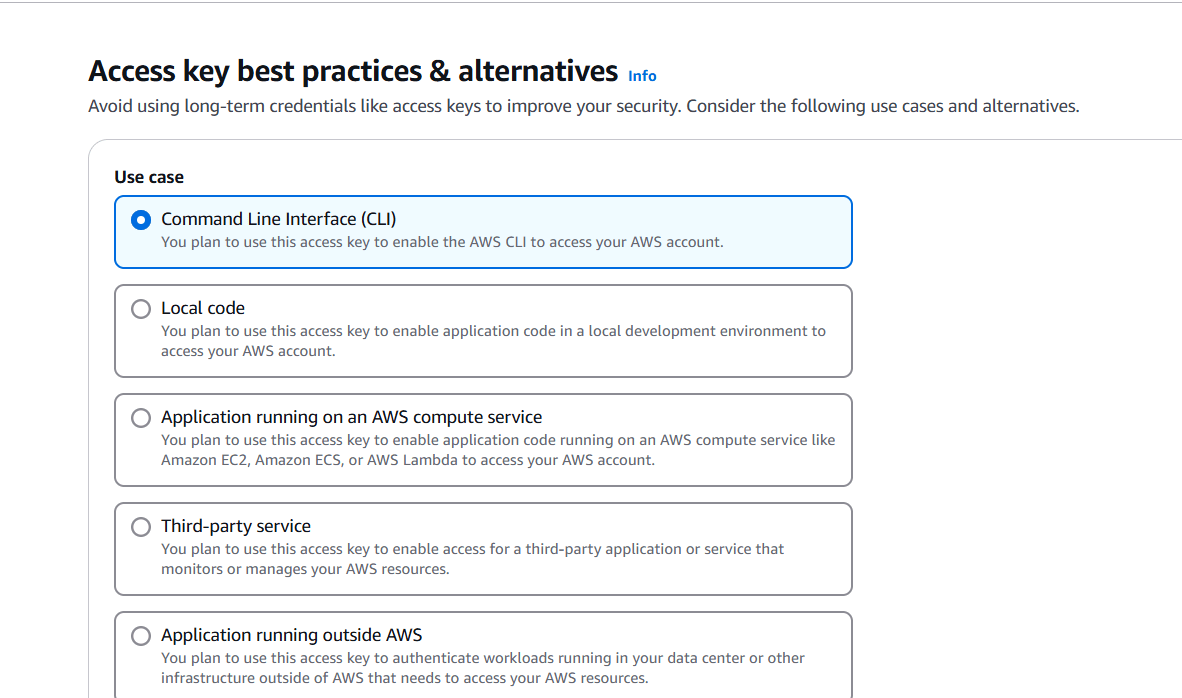
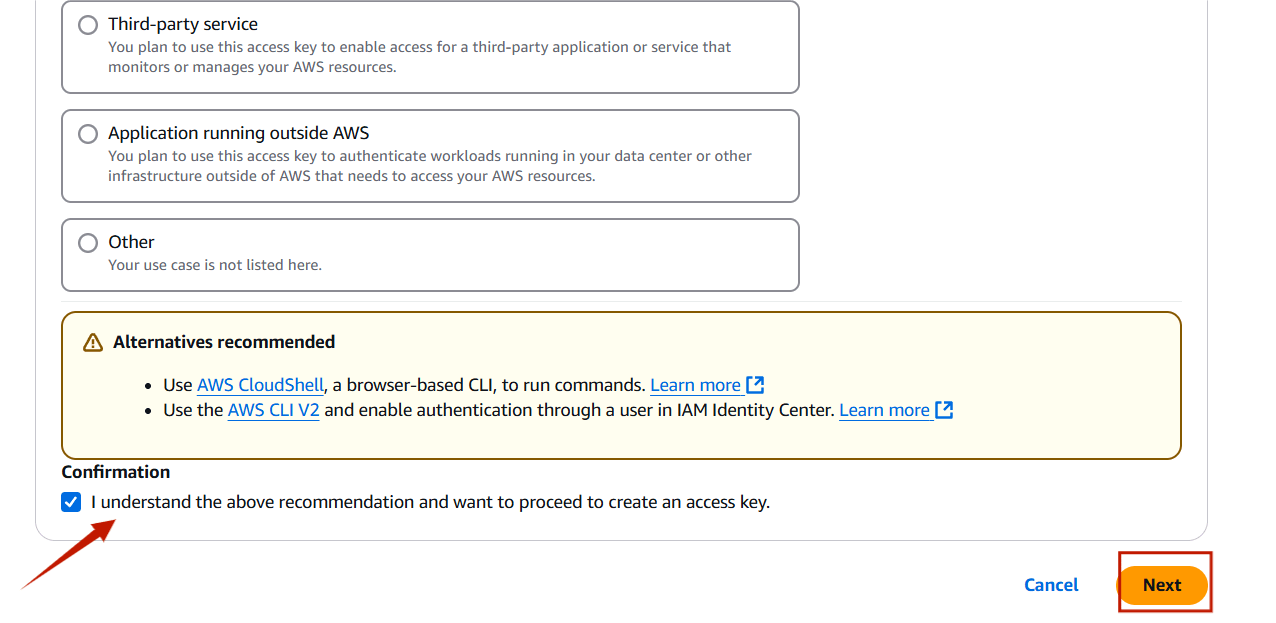
- Select the command line interface and tick confirmation.
- Click on create access key.
- Download the csv.file.
- You will get Access key and secret key.

TASK 3: Configure Profile Using AWS Configure Command.
STEP 1: Configuration.
aws configure
configure list- You will paste your Access key.
- Paste your Secret access key.
- Click on enter.


TASK 4: Create terraform file(.tf) & write the script.
STEP 1: Open your folder on your VScode.
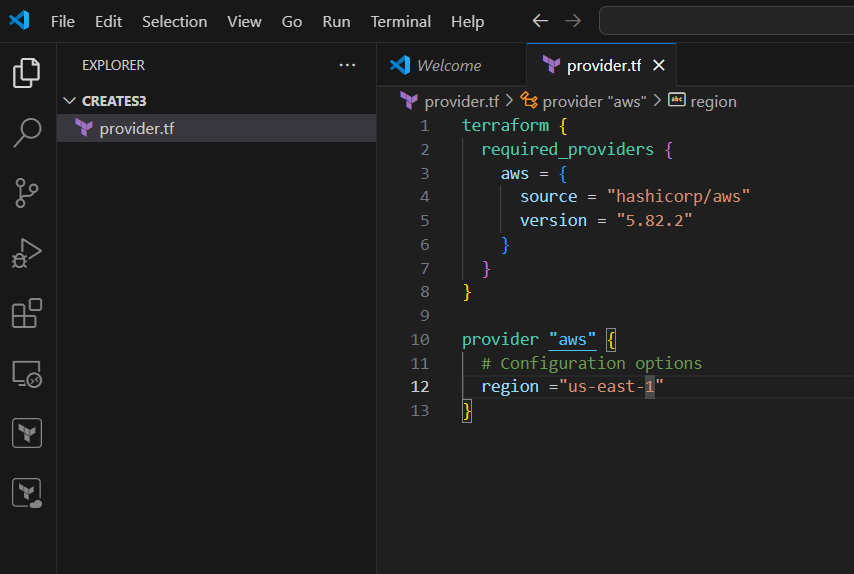
- Create the provider.tf file.
- Enter the following script.
terraform {
  required_providers {
    aws = {
      source = "hashicorp/aws"
      version = "5.82.2"
    }
  }
}

provider "aws" {
  # Configuration options
  region ="us-east-1"
}
STEP 2: Save the file.
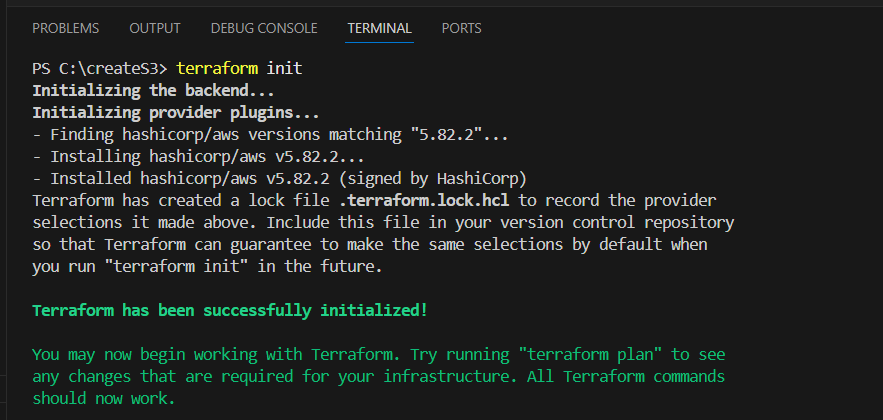
STEP 3: Open the terminal and enter the terraform init.
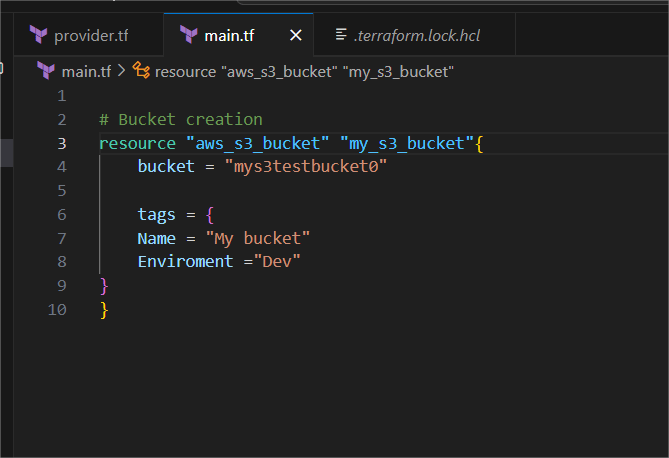
STEP 4: Create the another main.tf file.
- Enter the following script and save the file.
# Bucket creation
resource "aws_s3_bucket" "my_s3_bucket"{
    bucket = "mys3testbucket0"

    tags = {
    Name = "My bucket"
    Enviroment ="Dev"
}
}
TASK 5: Execute the terraform script.
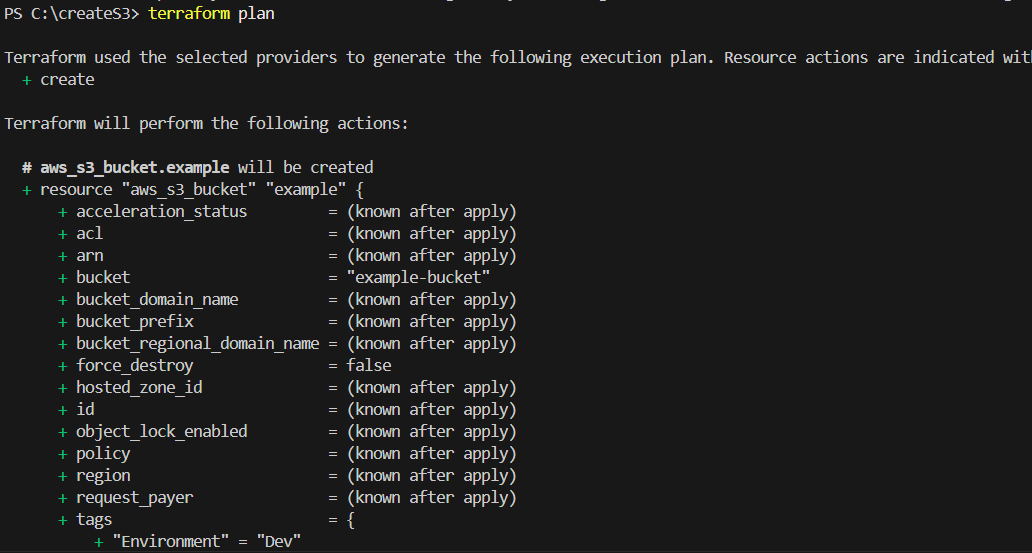
STEP 1: Go to terminal enter the terraform plan.
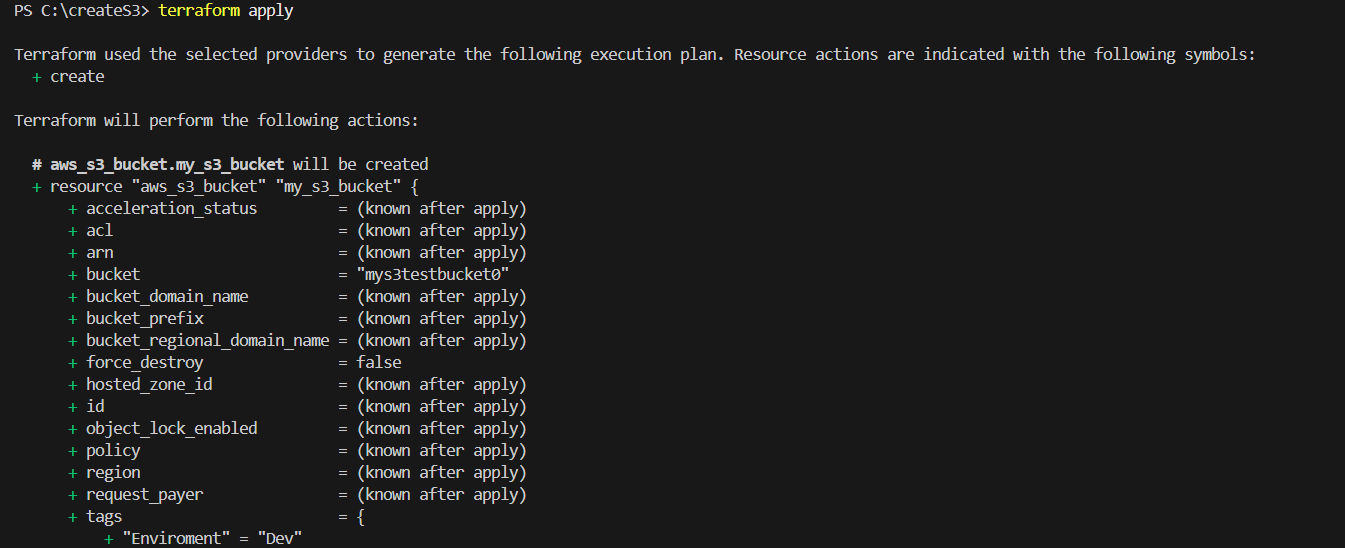
STEP 2: Then, next Enter the terraform apply.
TASK 6: Verify S3 bucket is create or not.
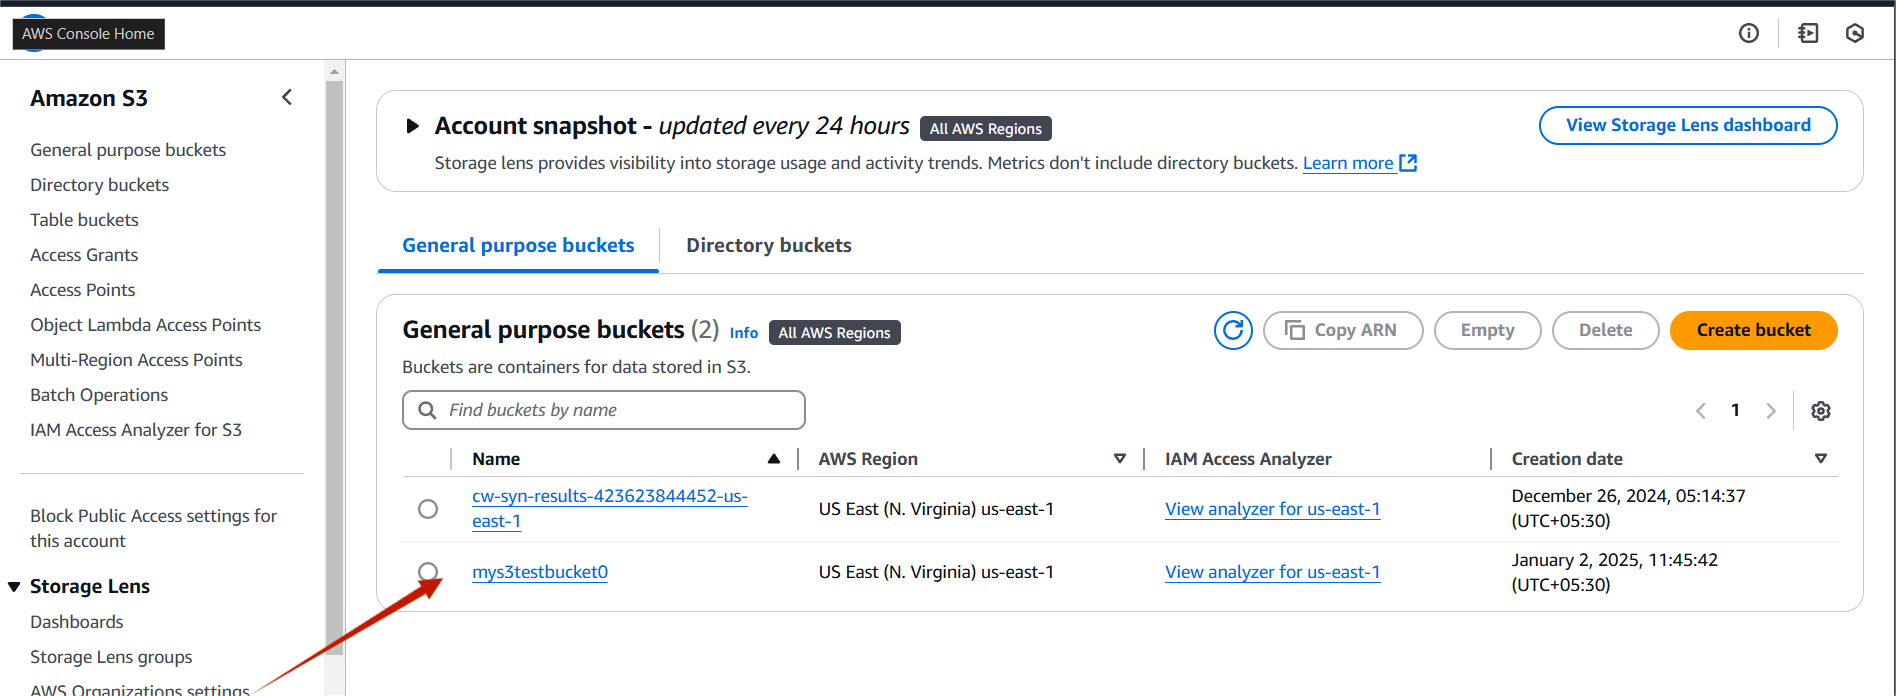
STEP 1: Go to S3 bucket and verify your bucket.
STEP 2: If you are delete your bucket you the terraform destroy command.


Conclusion.
In this tutorial, we’ve successfully demonstrated how to launch an Amazon S3 bucket using a Terraform script, with Visual Studio Code as our development environment. By following these steps, you can easily automate the creation and management of S3 buckets, saving time and reducing human error in your cloud infrastructure setup. Terraform’s declarative approach ensures that your configurations are repeatable and consistent, making it an ideal tool for scalable cloud management.
With this foundational knowledge, you can expand on this setup, integrating other AWS resources, and further optimizing your cloud environment using Terraform. Happy coding and deploying!
How to Set Up and Create Monitors Using Amazon CloudWatch Synthetics.
Introduction.
In this article, we’ll explore an introduction to Amazon CloudWatch Synthetics and its key features. Amazon CloudWatch Synthetics is a service offered by AWS that enables you to monitor your web applications and APIs by simulating user interactions with them. you can create different kinds of Canaries to continually verify your user experience even when you don’t have traffic, monitor and test for unusual behavior, and trace issues to their source for faster resolution. CloudWatch Synthetics is helpful for identifying issues before they impact real users, providing proactive monitoring of your systems and applications. It supports a range of use cases like monitoring APIs, website uptime, or even simulating complex workflows like login or checkout processes. CloudWatch Synthetics integrates directly with AWS CloudWatch, enabling you to track metrics and logs in real-time. You can schedule tests at regular intervals (e.g., every minute, every 5 minutes) to ensure constant monitoring. If a monitor fails, you can configure CloudWatch to send notifications via email, SMS, or trigger an AWS Lambda function for automated remediation.

Use Cases for CloudWatch Synthetics.
- Check the health of APIs by simulating requests and ensuring they are responding correctly.
- Measure response times, latency, and overall performance by simulating user journeys through your application.
- Ensure your website is accessible and functioning as expected by running synthetic user tests at regular intervals.
- You can test more than just availability; you can automate user interactions like logging in or making a purchase to ensure that your web application behaves as expected in real-world scenarios.
Now, let’s dive into how to create an Amazon CloudWatch Synthetics monitor.
STEP 1: Sign in to AWS Console.
- Go to the Amazon CloudWatch console.
- In the left navigation pane, choose Synthetics under the CloudWatch section.
- Select create canary.
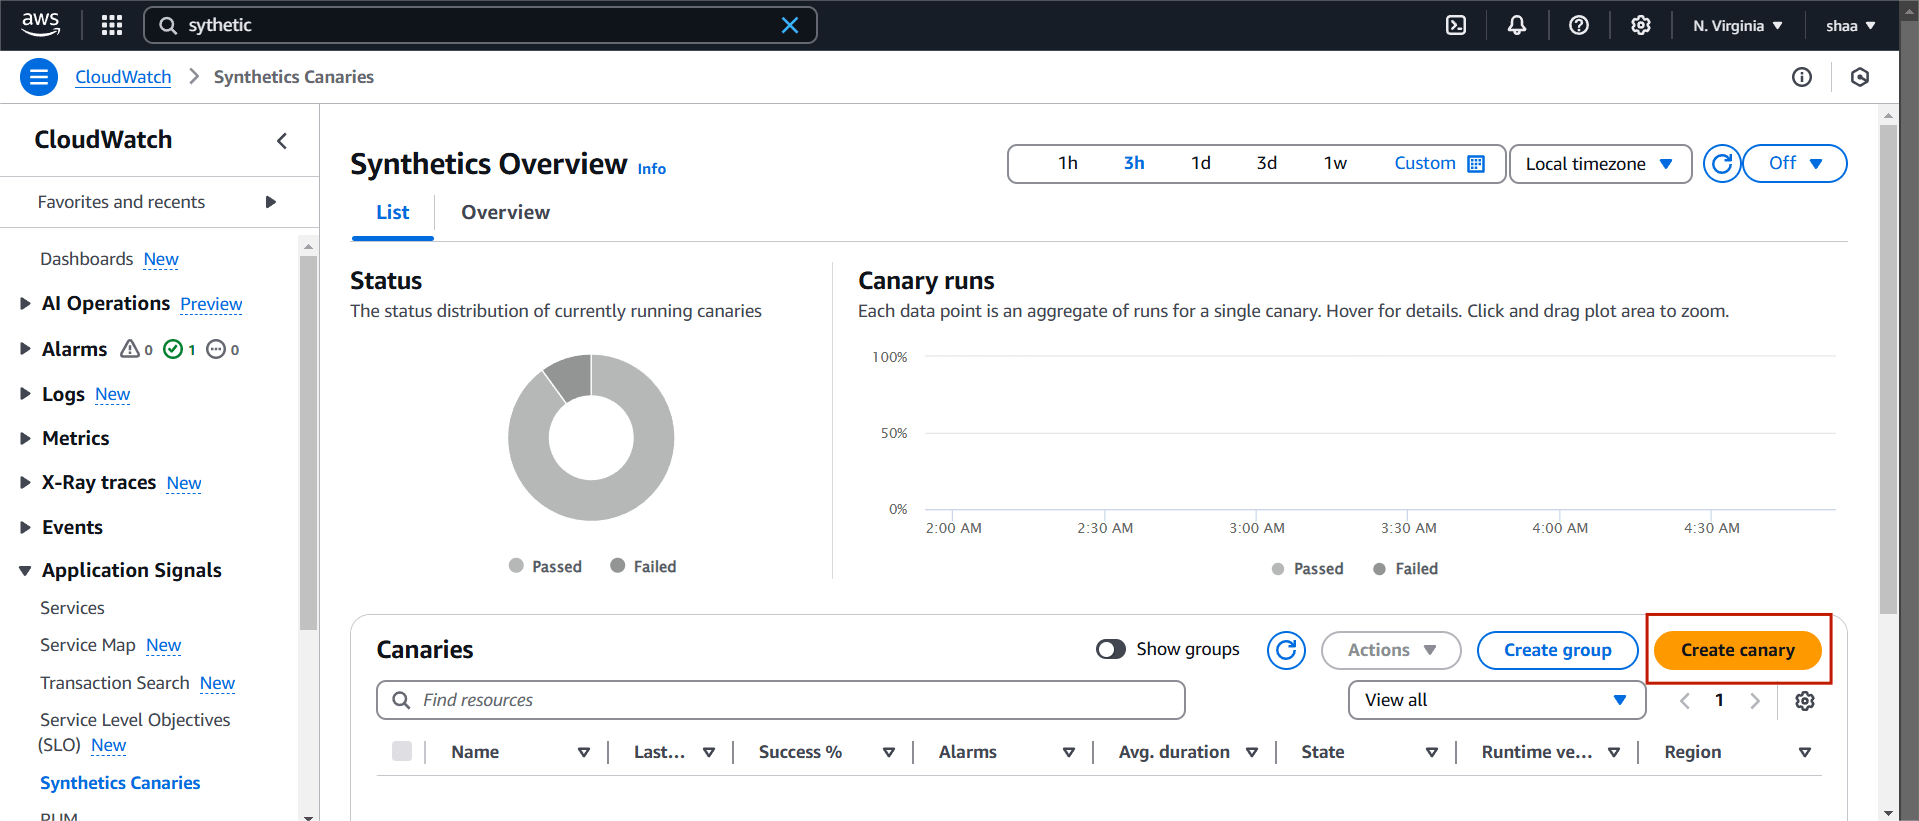
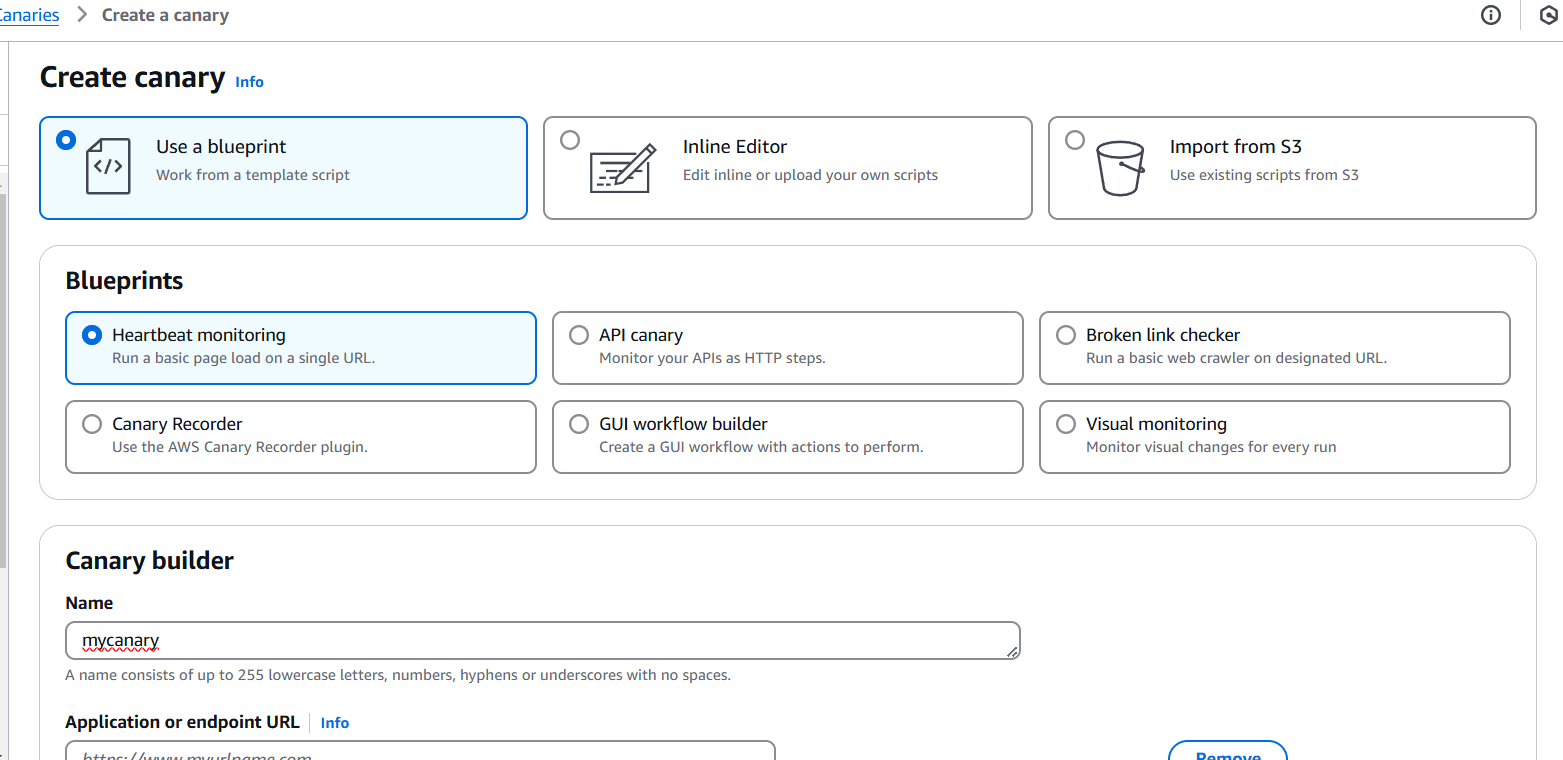
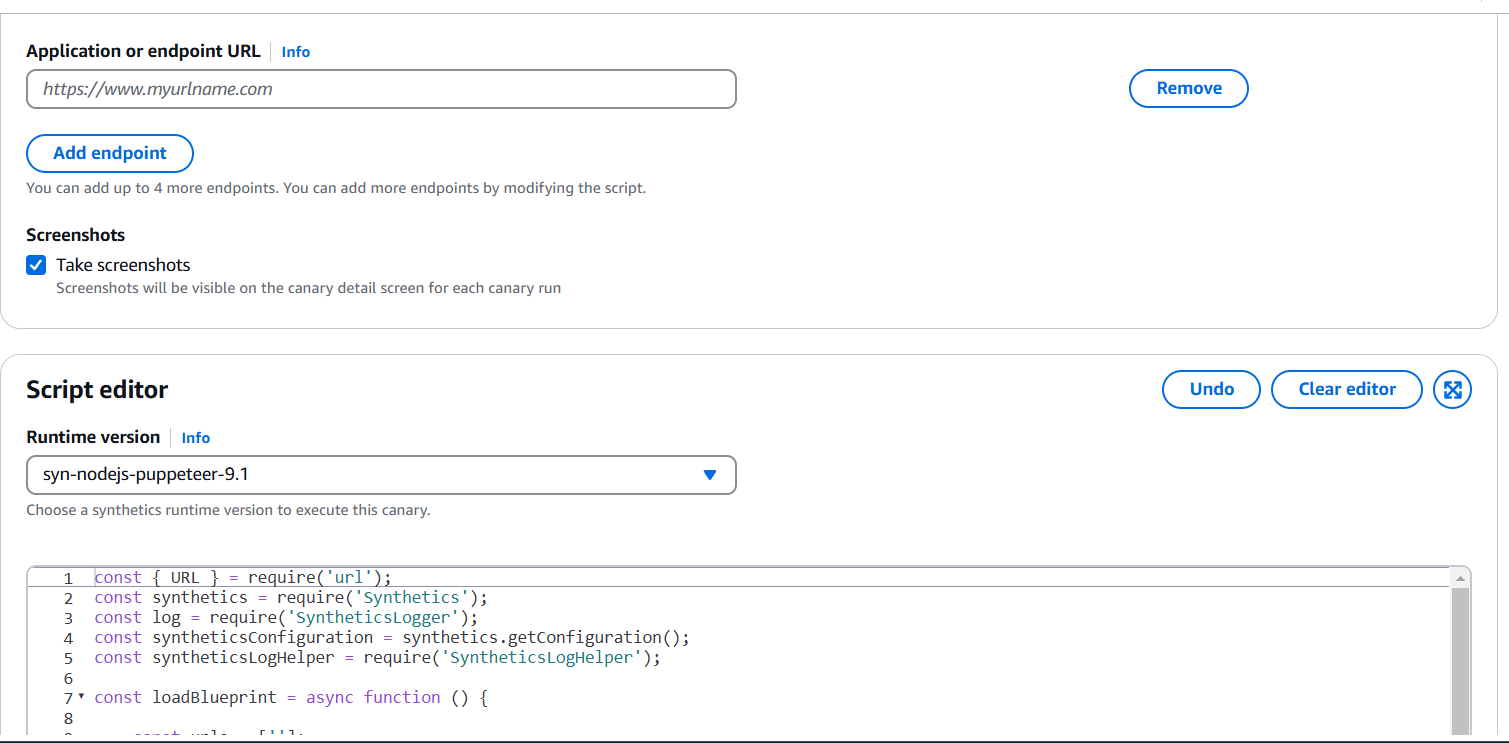
STEP 2: Canaries can be created using pre-existing blueprints, with scripts that can be edited inline, or through the use of a workflow builder or canary recorder.
- Enter the canary name.
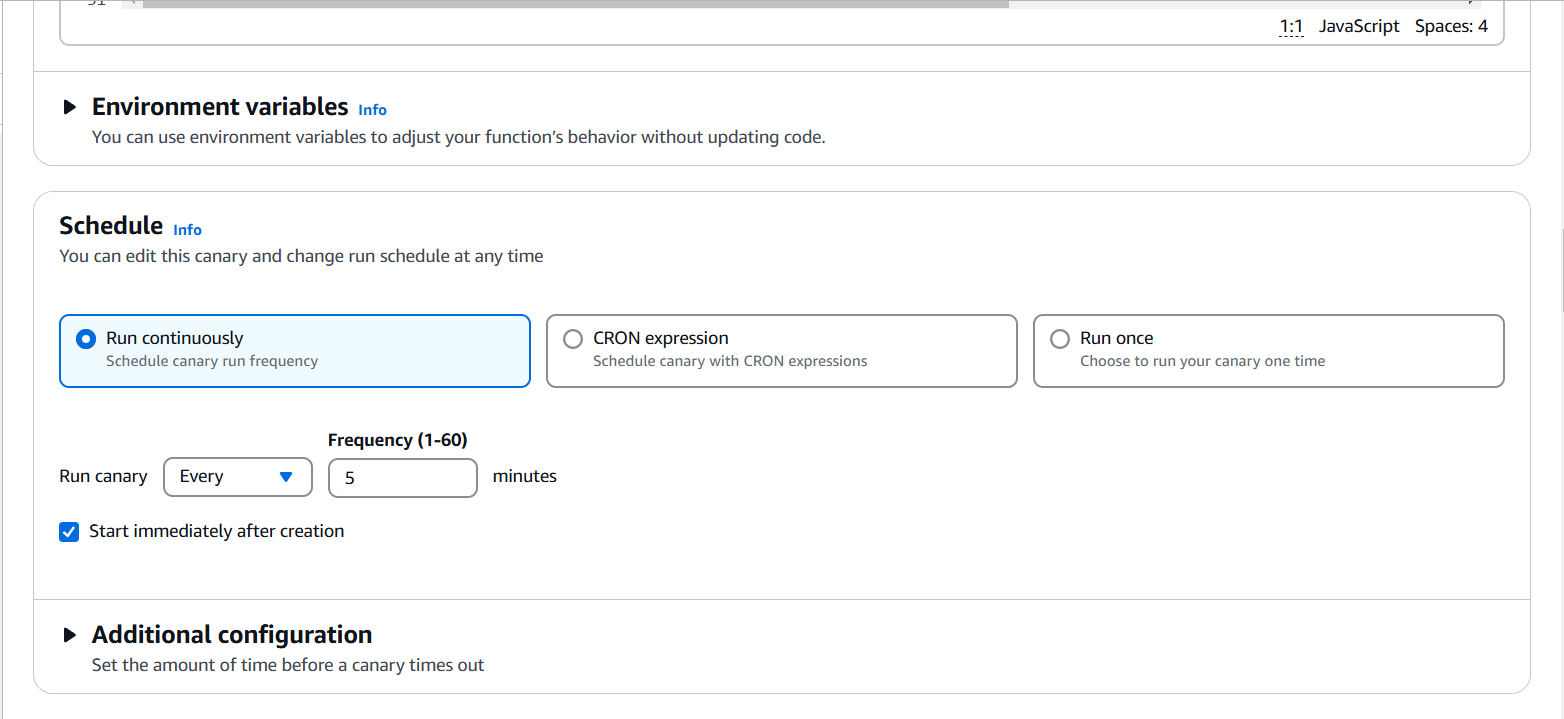
STEP 3: You will also keep the default scheduling settings.
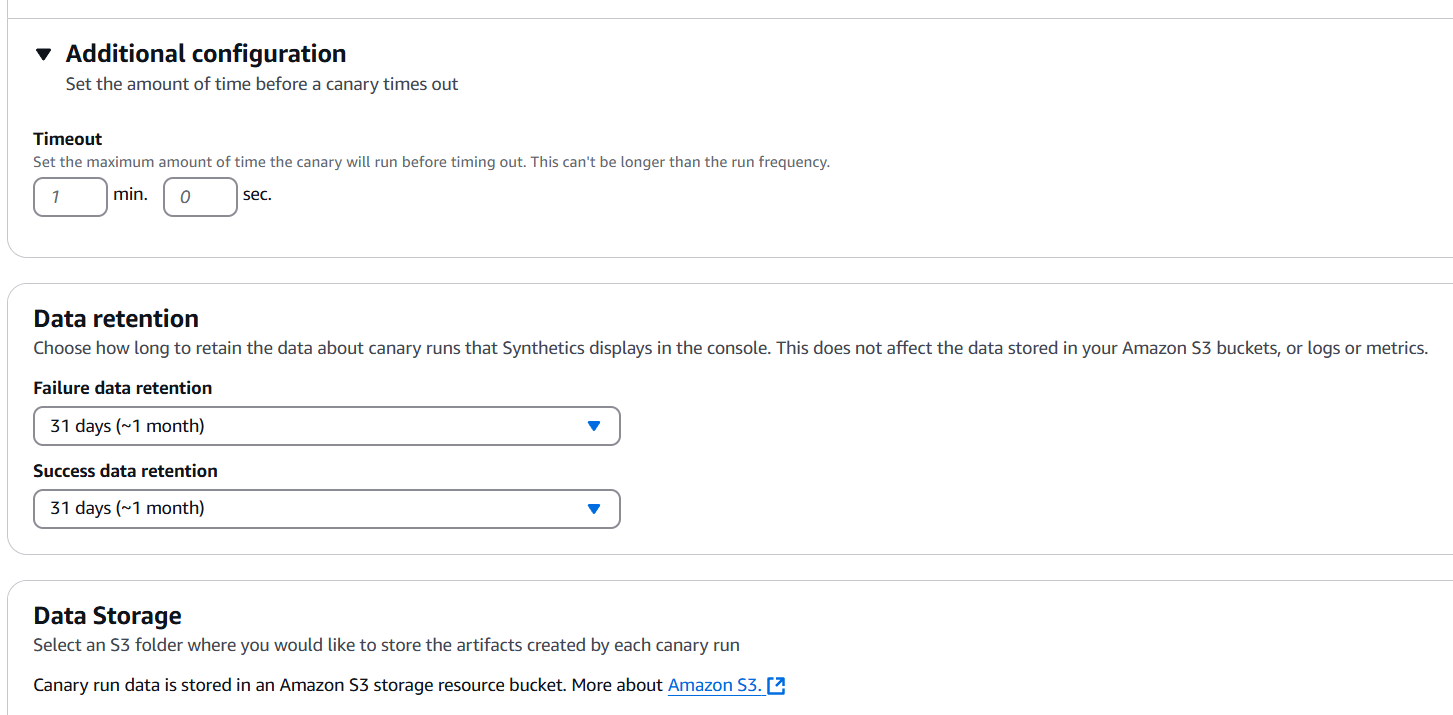
STEP 4: If you have specific data retention policies, you can adjust the default settings here to ensure compliance.
STEP 5: You will select the S3 location.
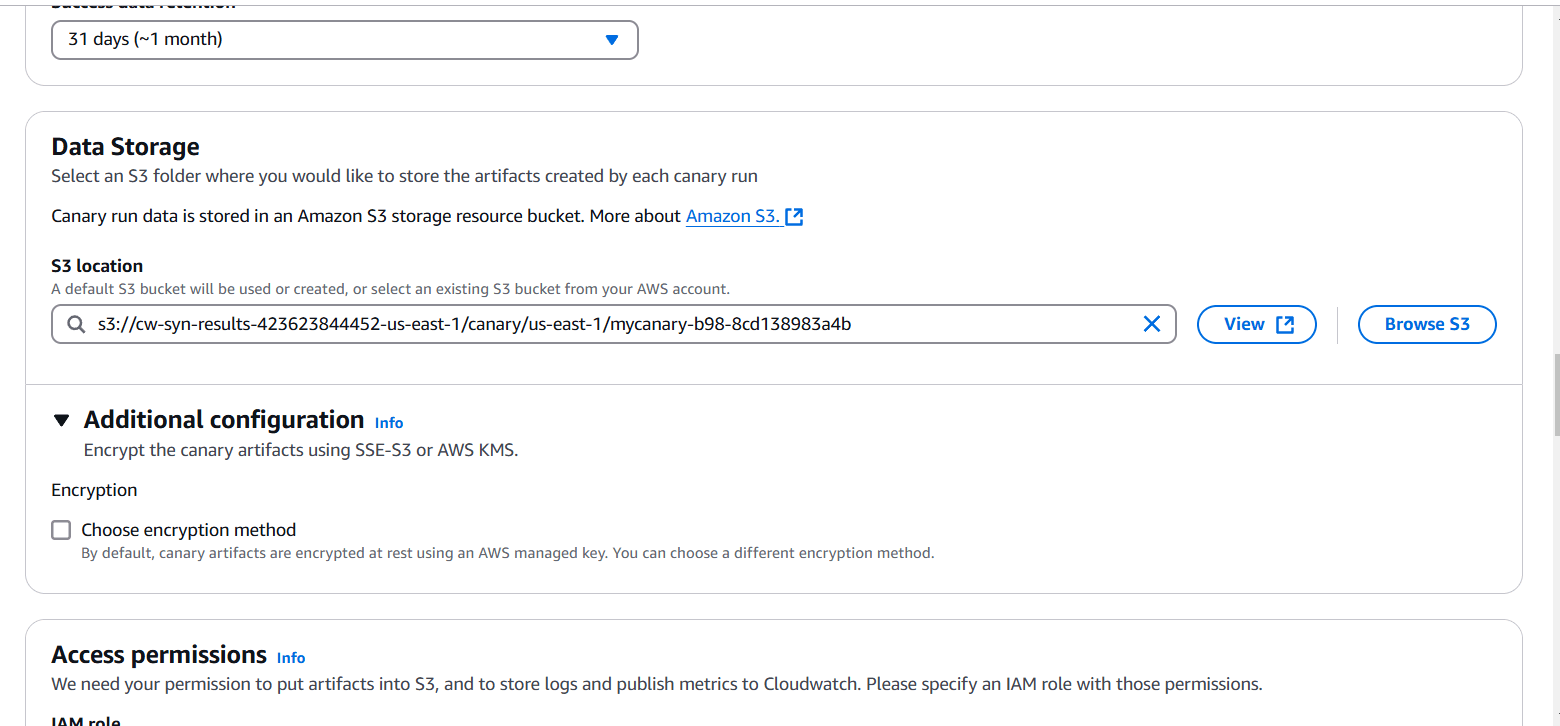
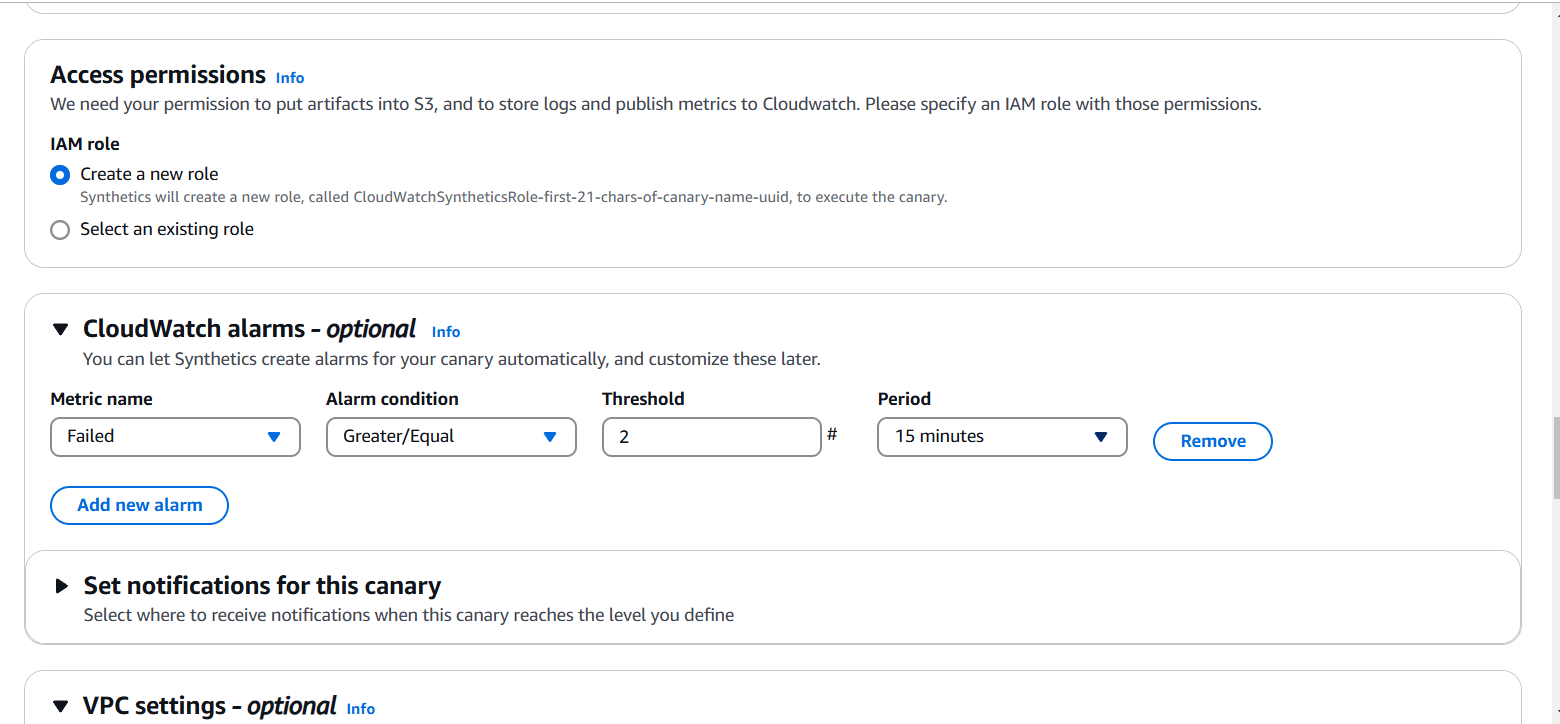
STEP 6: Click on create a new role.
- You can enable CloudWatch Synthetics to automatically create alarms for your canaries. Let’s set up an alarm to notify us via Amazon SNS if the canary fails two or more times within 15 minutes.
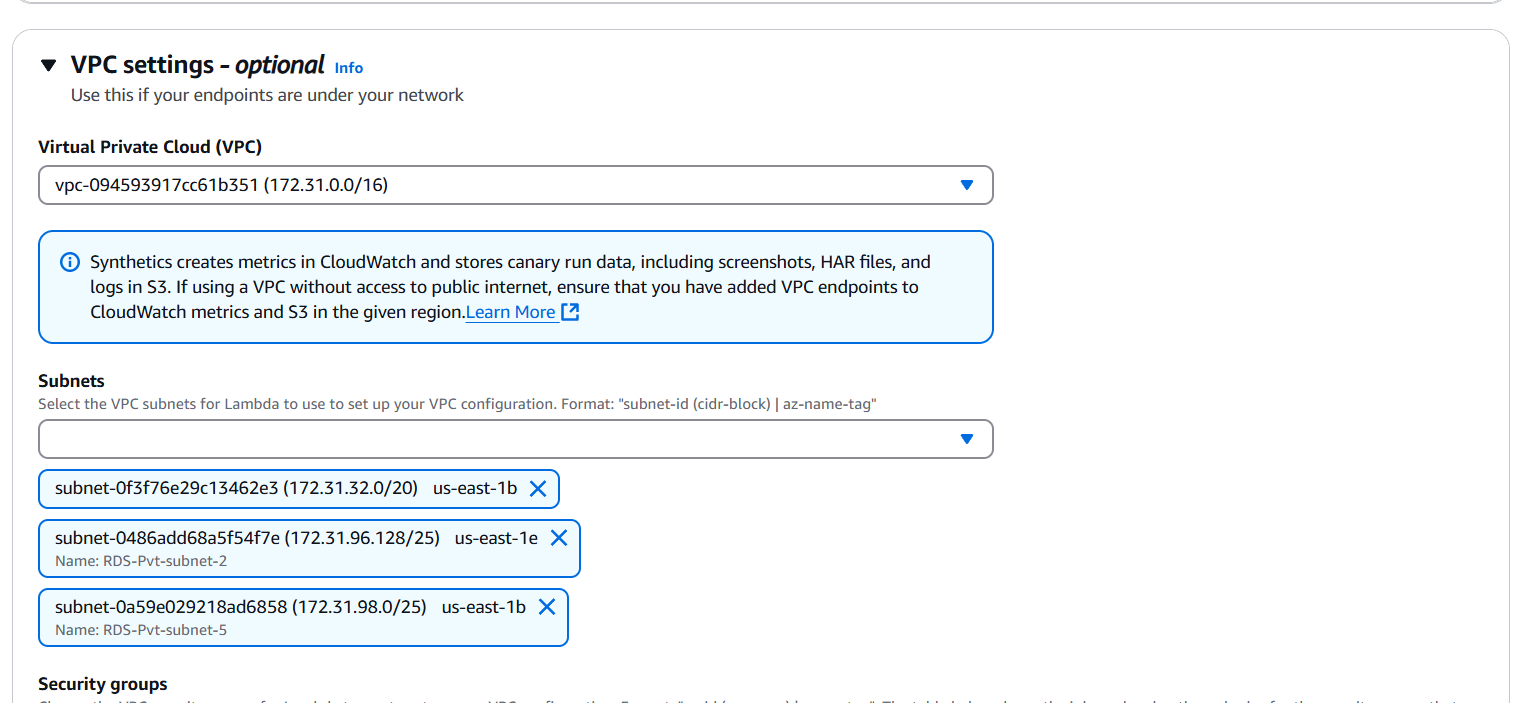
STEP 7: Select VPC and Subnets.
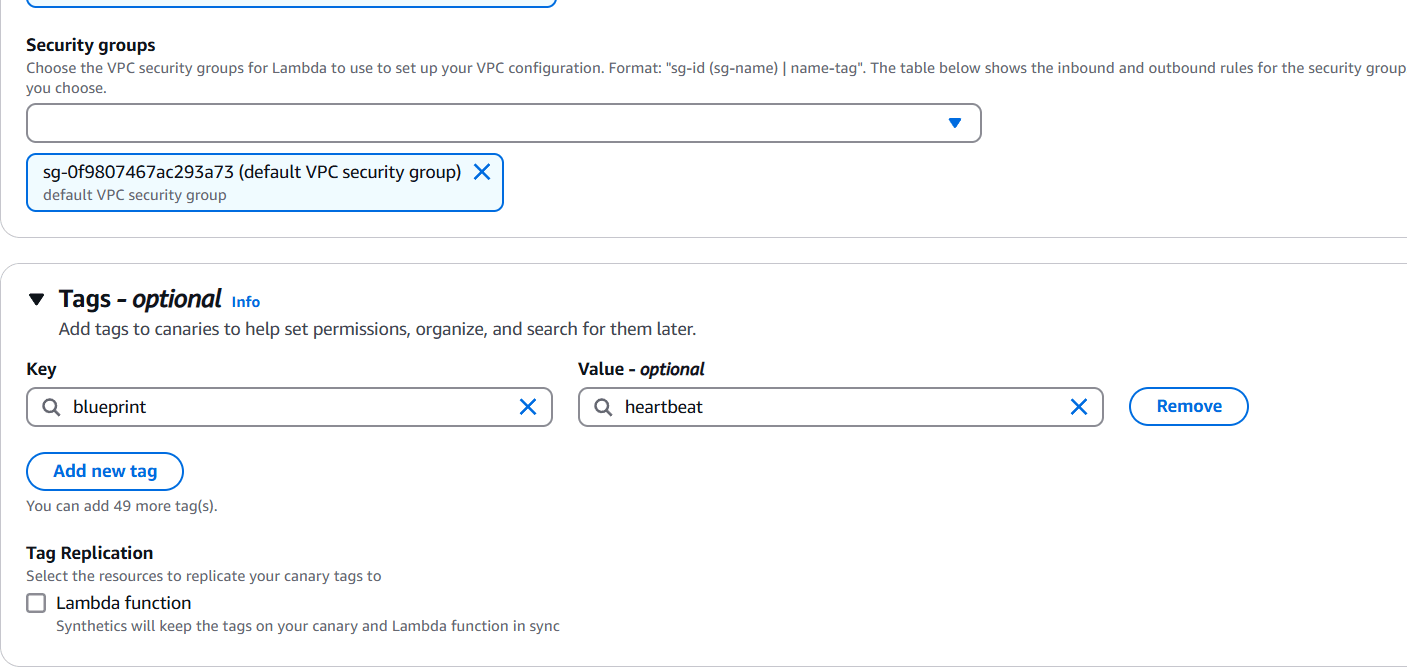
STEP 8: Select security group.
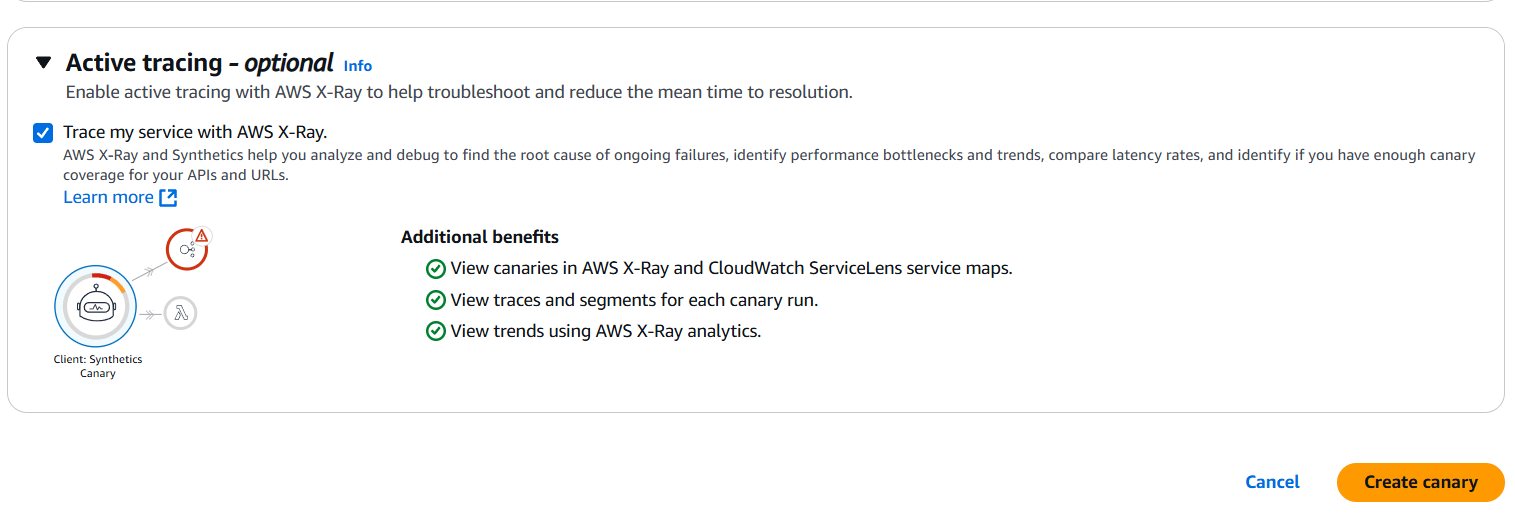
STEP 9: Tick on Active tracing and click create canary.
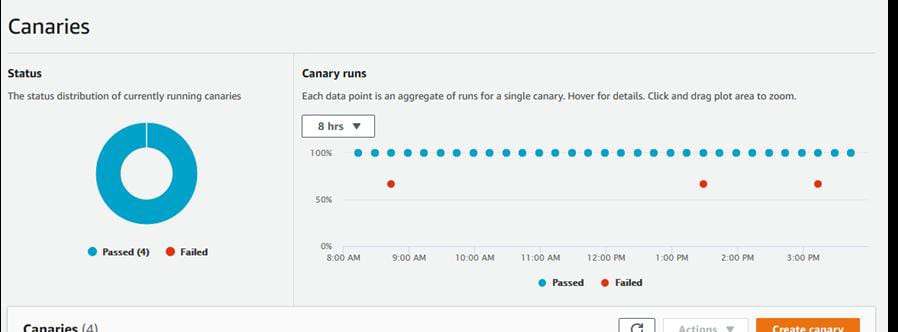
STEP 10: It will take a few minutes to create


Conclusion.
Our heartbeat monitoring canary has been successfully created. Amazon CloudWatch Synthetics provides a powerful way to monitor your web applications and APIs by simulating real user interactions. With its ability to create automated tests, schedule monitoring intervals, and integrate with other AWS services like CloudWatch Alarms and SNS, it helps ensure the availability and performance of your applications. By leveraging CloudWatch Synthetics, you can proactively identify issues, maintain compliance with data retention policies, and enhance the overall user experience. Whether you are monitoring simple websites or complex workflows, CloudWatch Synthetics is a valuable tool for maintaining application health in the cloud.
A Step-by-Step Guide to Creating and Testing Lambda Functions.
Introduction.
AWS Lambda function is a bit different than managing containerized applications (like Docker), and there is no direct way to rename a Lambda function once it has been created. AWS Lambda is a serverless computing service provided by Amazon Web Services (AWS) that allows you to run code in response to events without provisioning or managing servers. Lambda functions are triggered by various AWS services and external events. It automatically manages the compute resources required to run your code, scaling them up or down depending on demand. Lambda is designed to make it easier to build applications that respond to events and scale automatically, without having to worry about infrastructure management.

Diagram.
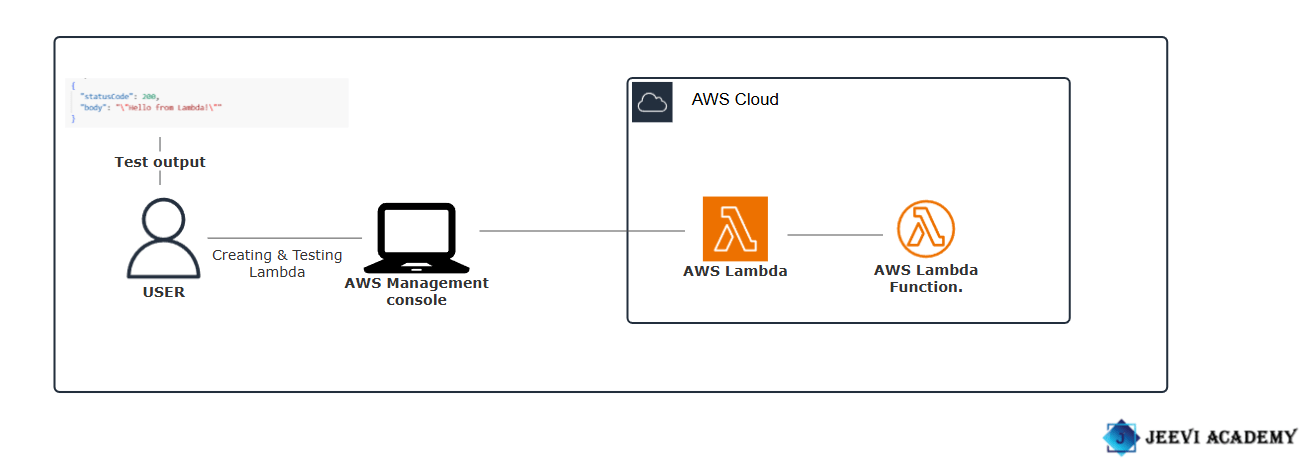
Let’s begin with creating and testing Lambda functions.
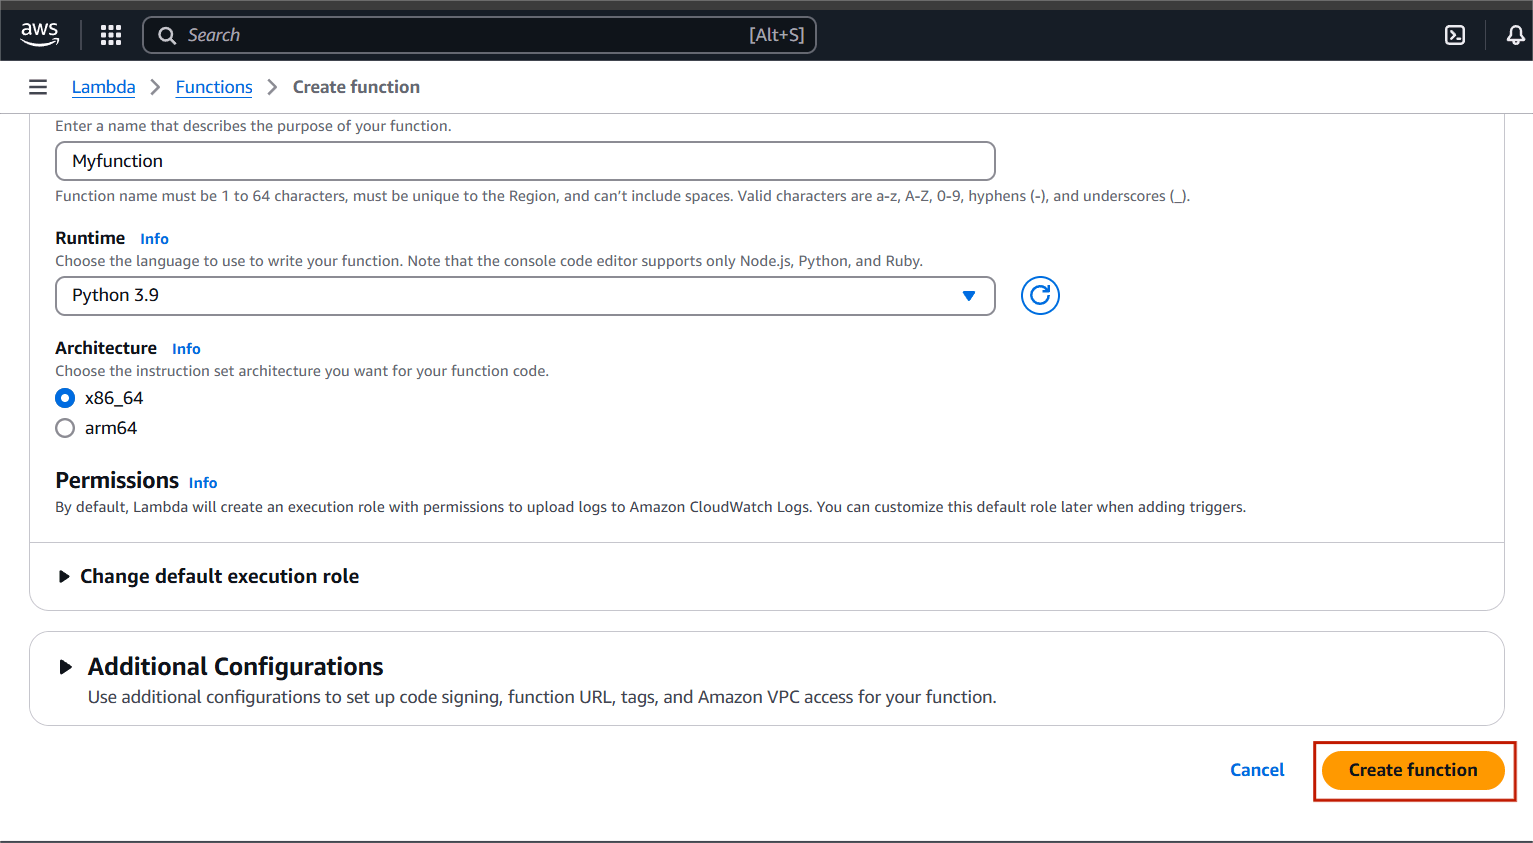
STEP 1: Navigate the aws lambda and click on create a function.


STEP 2: Enter the Function name.
- Select the python3.9.
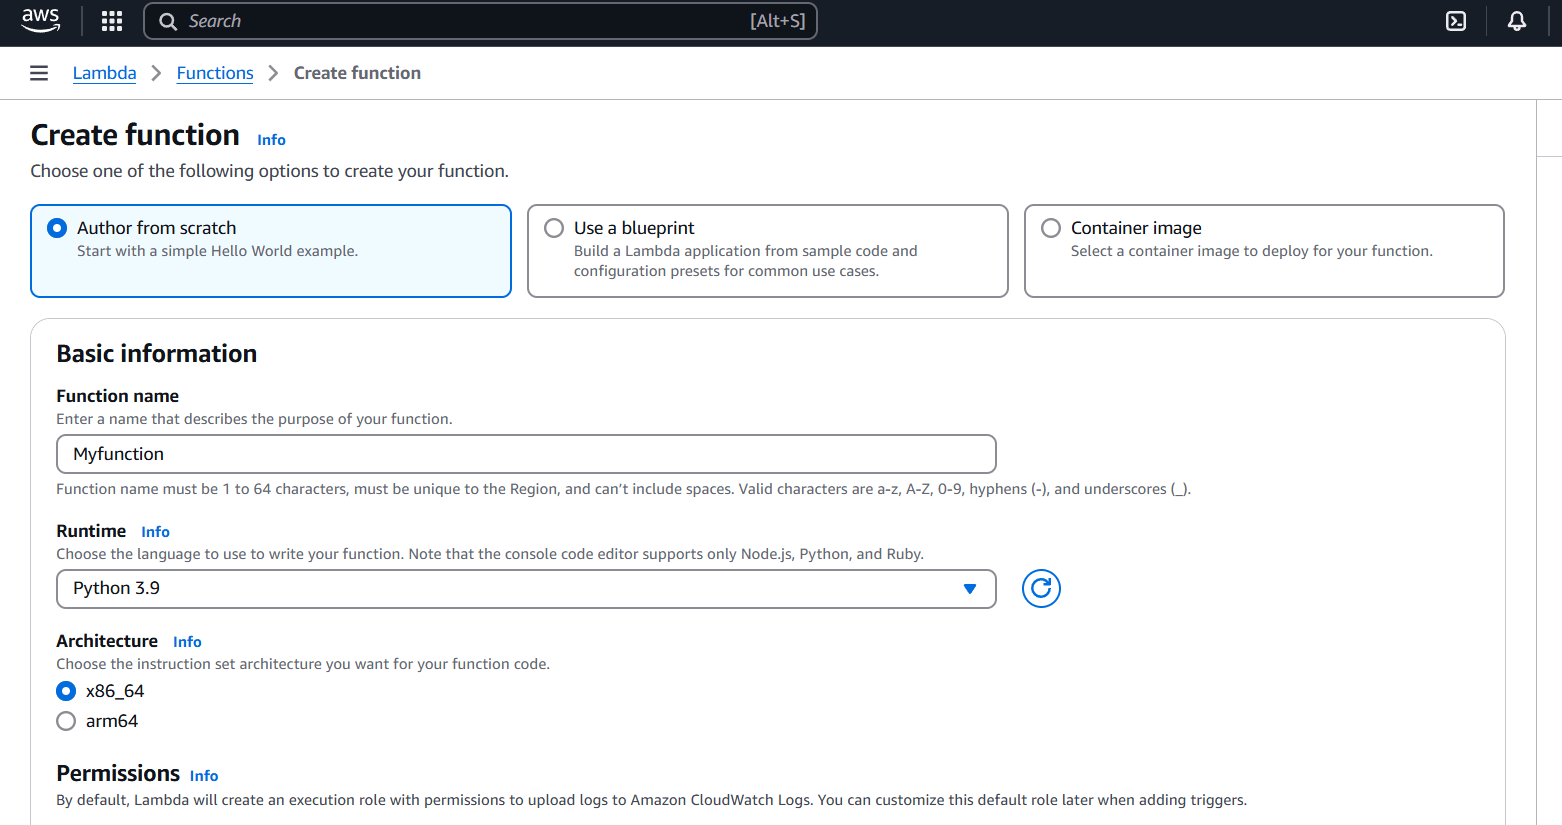
STEP 3: Click create a function.
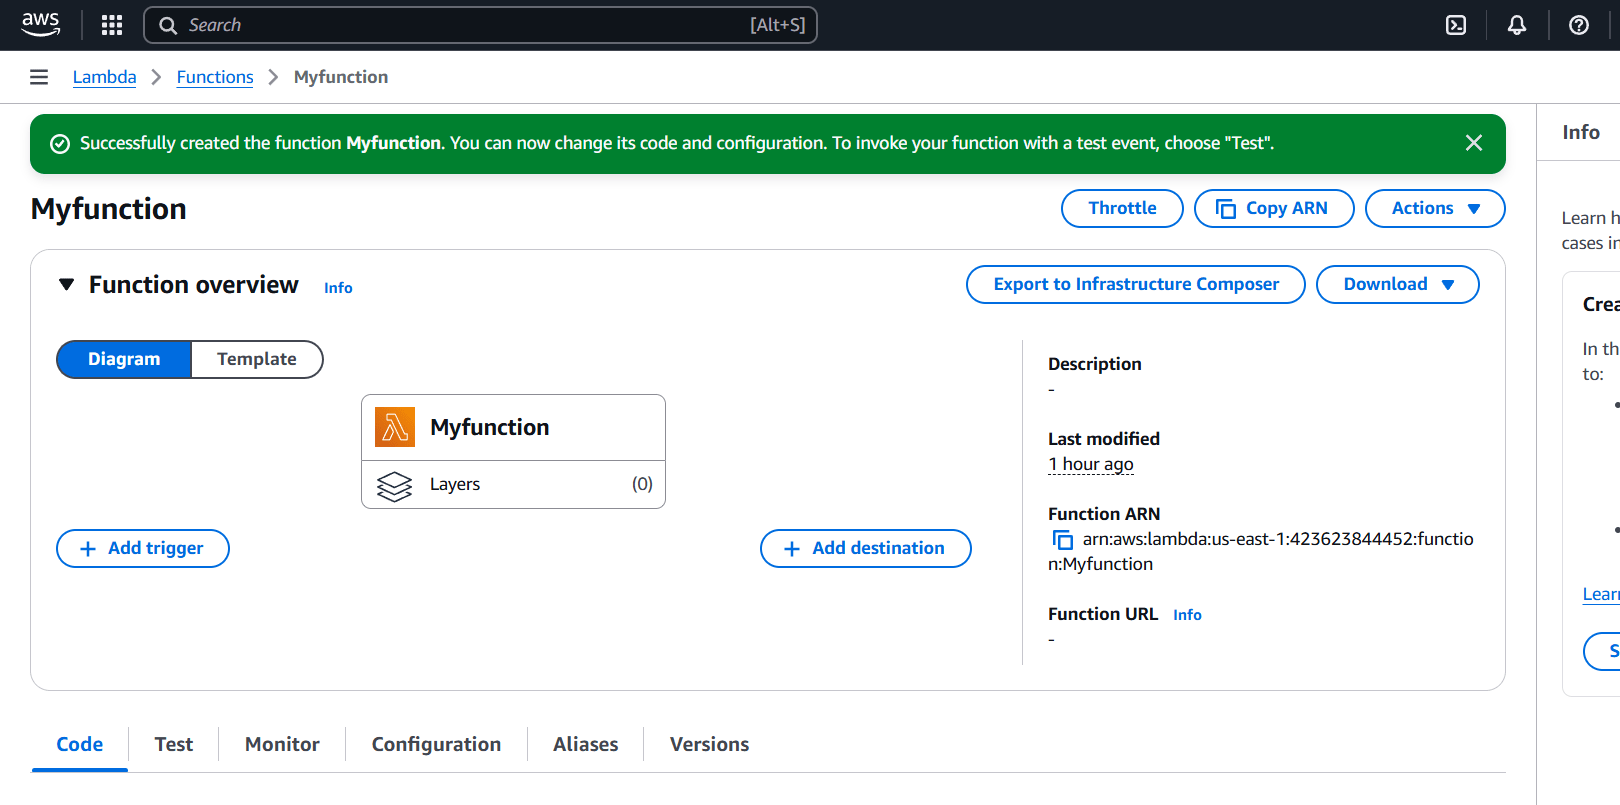
STEP 4: You will see you lambda function.
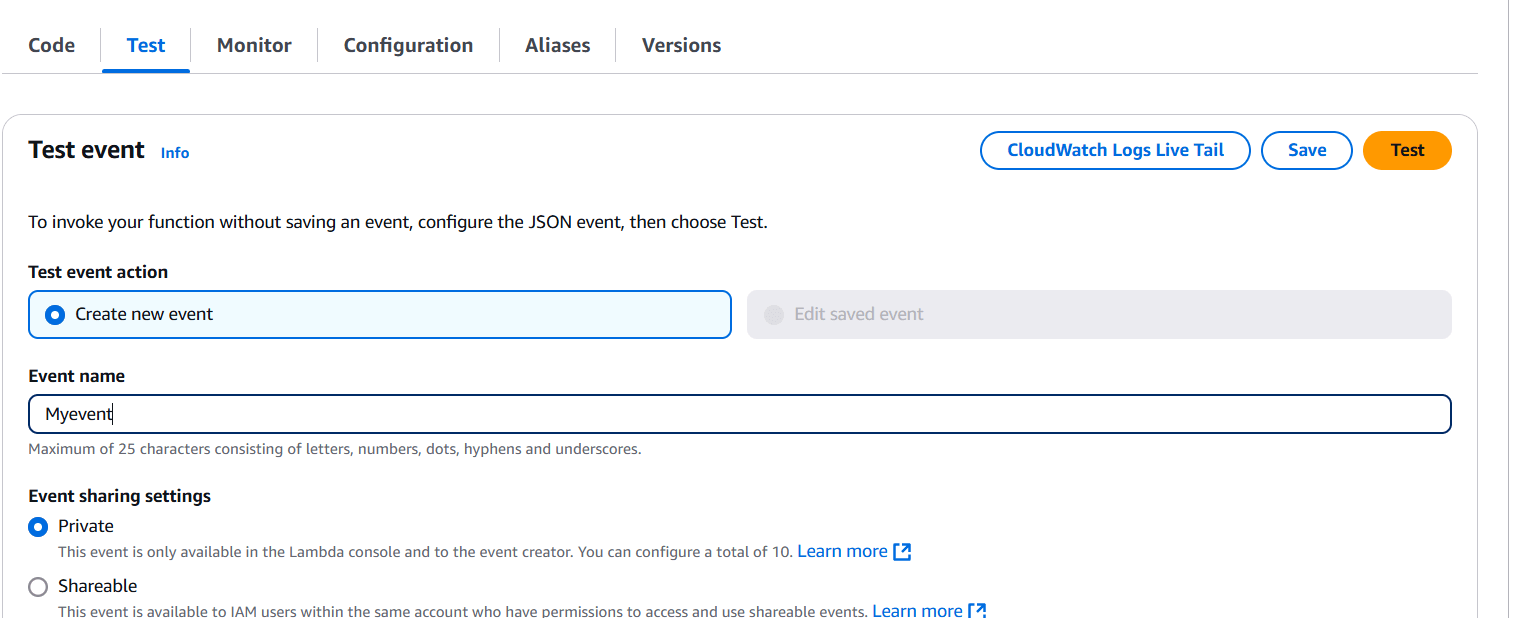
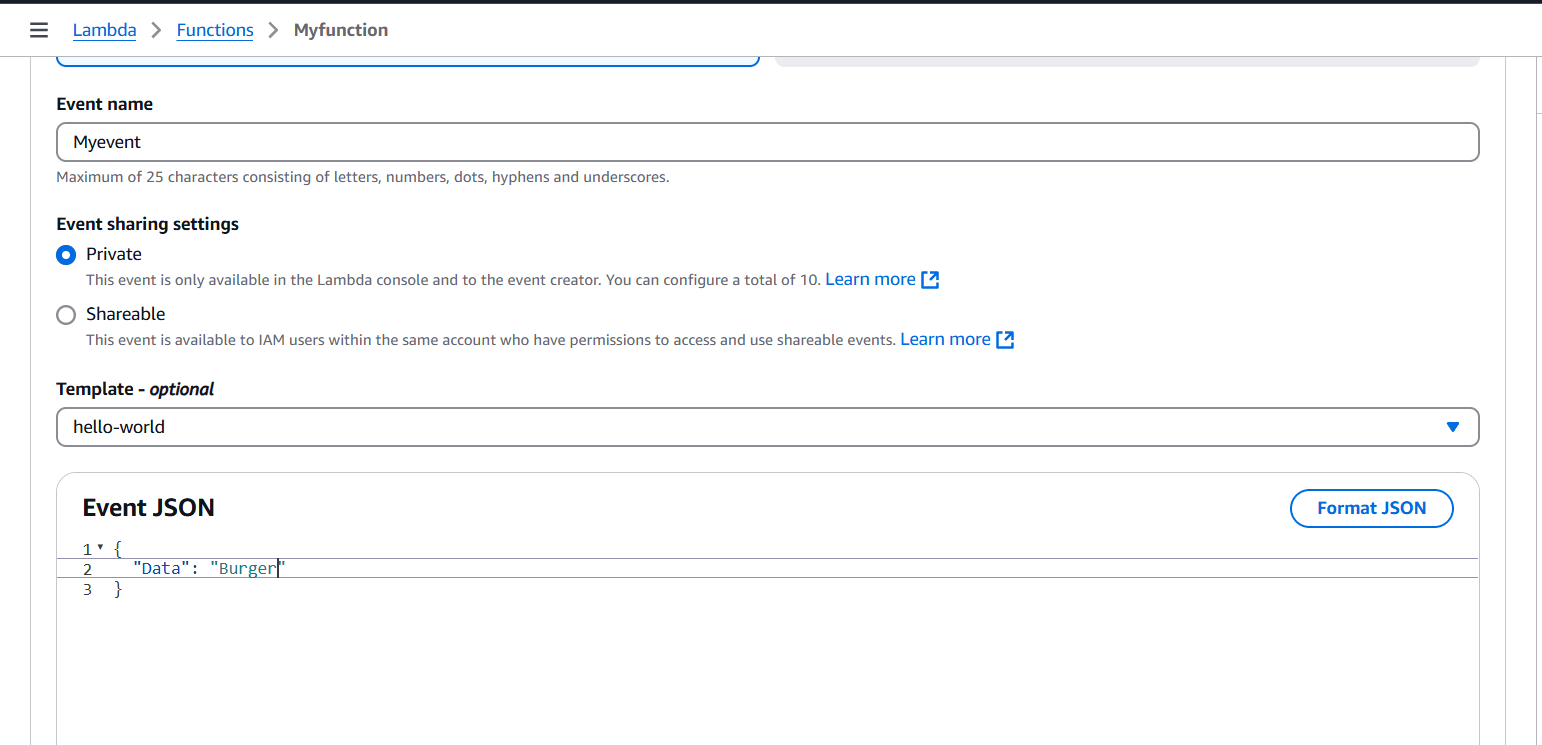
STEP 5: Scroll down Select the configuration.
- Enter the event name.
- Select private and click the test button.
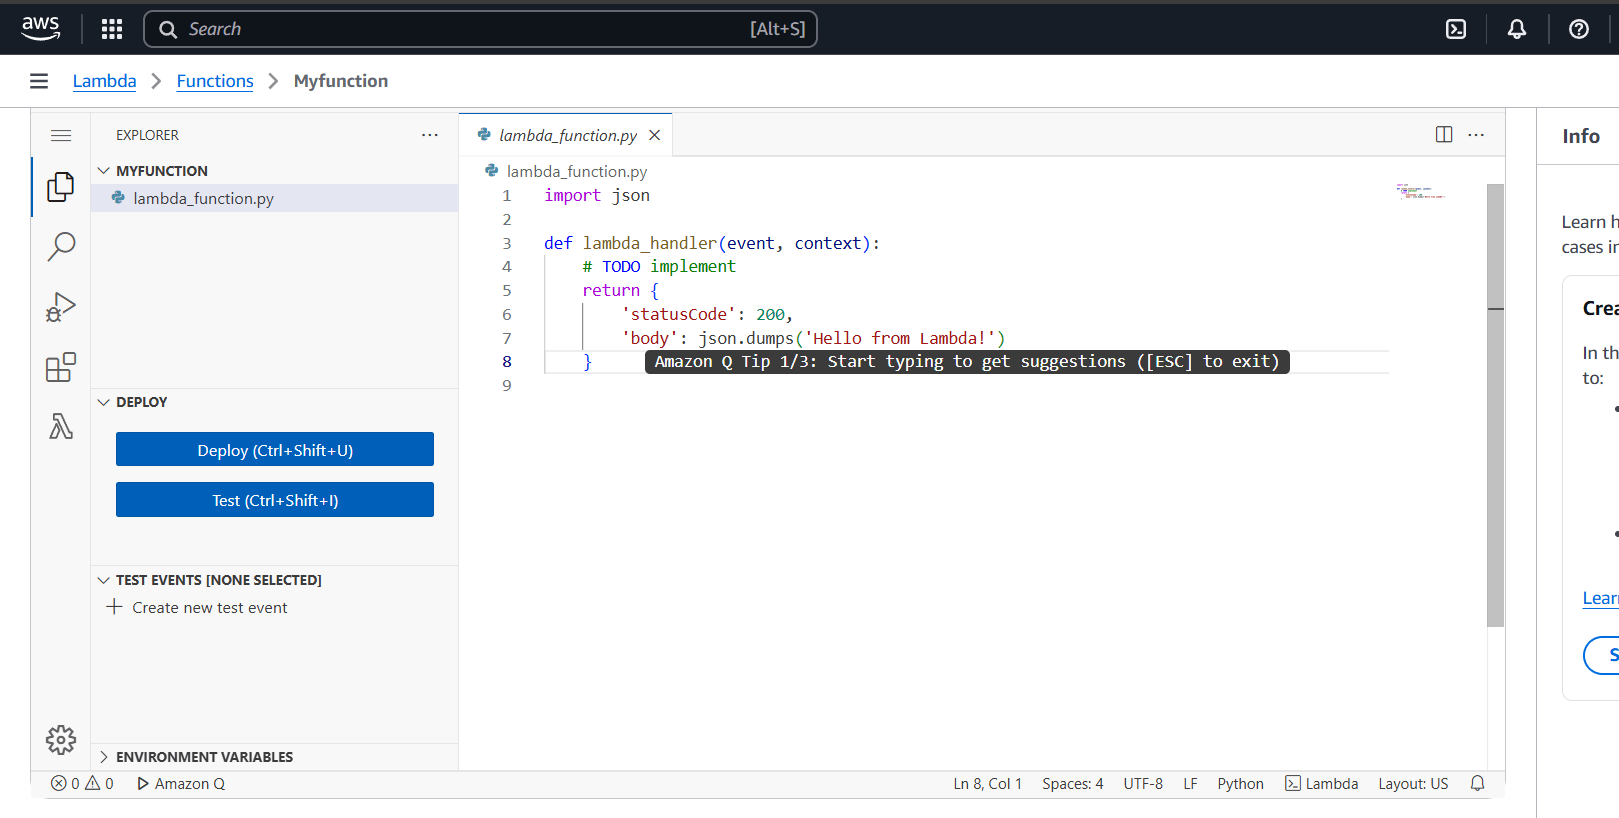
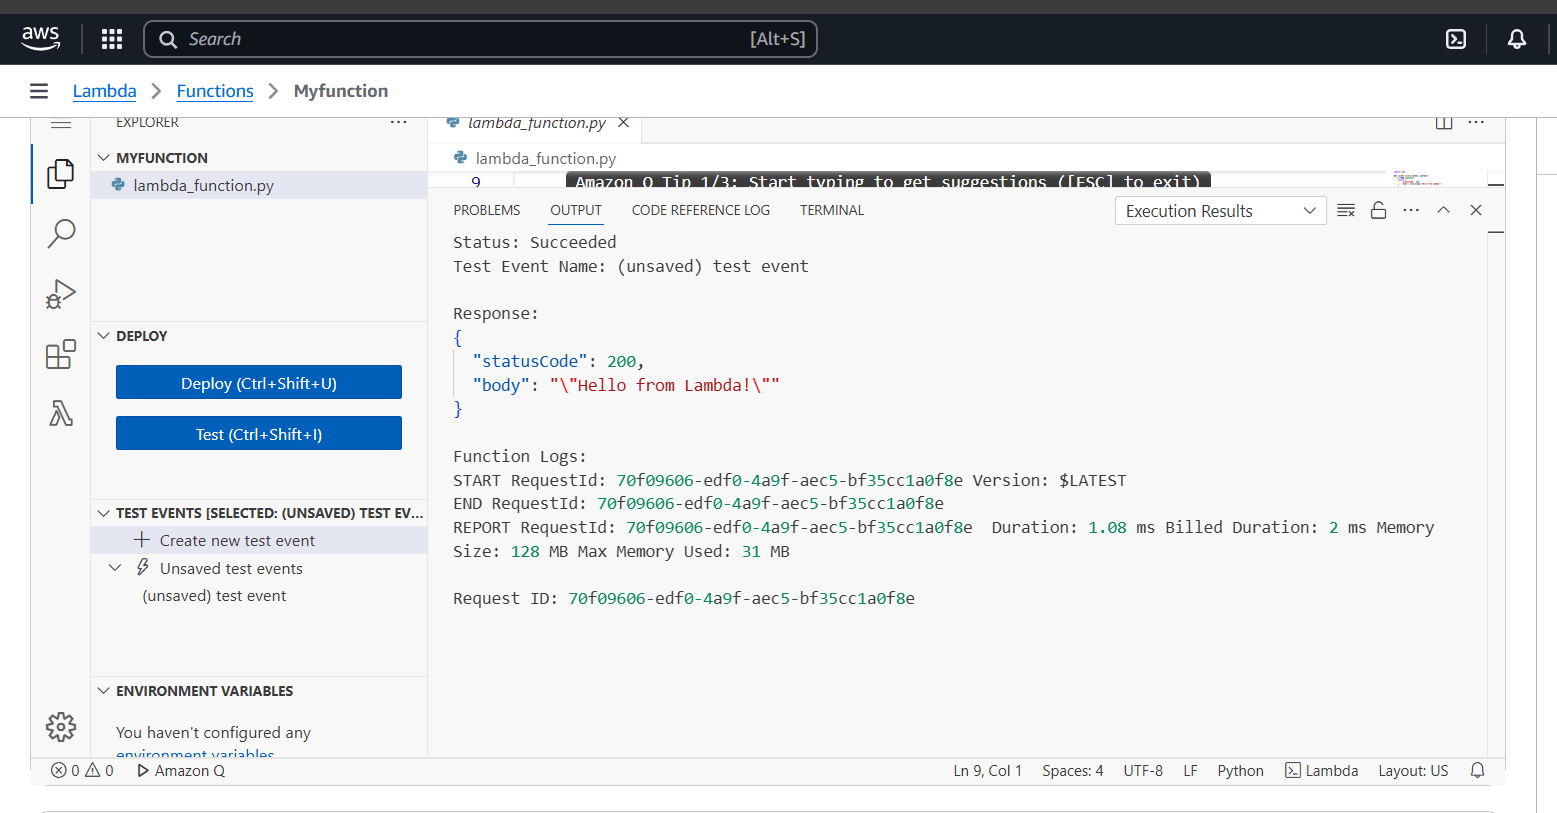
STEP 6: You see the test output on the terminal.

Conclusion.
In this guide, we’ve walked through the essential steps of creating and testing AWS Lambda functions. From setting up your function to understanding the event-driven architecture and automatic scaling, Lambda offers a powerful and efficient solution for serverless computing. By following these steps, you’ve learned how to quickly build scalable applications without the overhead of managing servers. As you continue to explore AWS Lambda, remember to take advantage of the wide range of integrations and testing tools AWS offers. The more you experiment with Lambda’s capabilities, the more you can unlock its potential to improve application performance and reduce infrastructure costs. So, start building, testing, and refining your Lambda functions today, and experience firsthand the benefits of serverless computing!
A Step-by-Step Guide to Configuring AWS Application Load Balancer.
Introduction.
As cloud computing becomes increasingly integral, it’s vital to ensure your applications can scale to meet varying traffic demands while maintaining performance and reliability. Amazon Web Services (AWS), one of the largest and most widely used cloud platforms, offers a variety of solutions for this purpose, with load balancing being a key component. Load balancing is essential to distribute network traffic across multiple resources, ensuring optimal utilization of resources and avoiding overloading any single server. It is an essential aspect of any large-scale and scalable computing system, as it helps you to improve the reliability and performance of your applications.

In this blog post, we’ll guide you through setting up and using Amazon’s load balancing services.
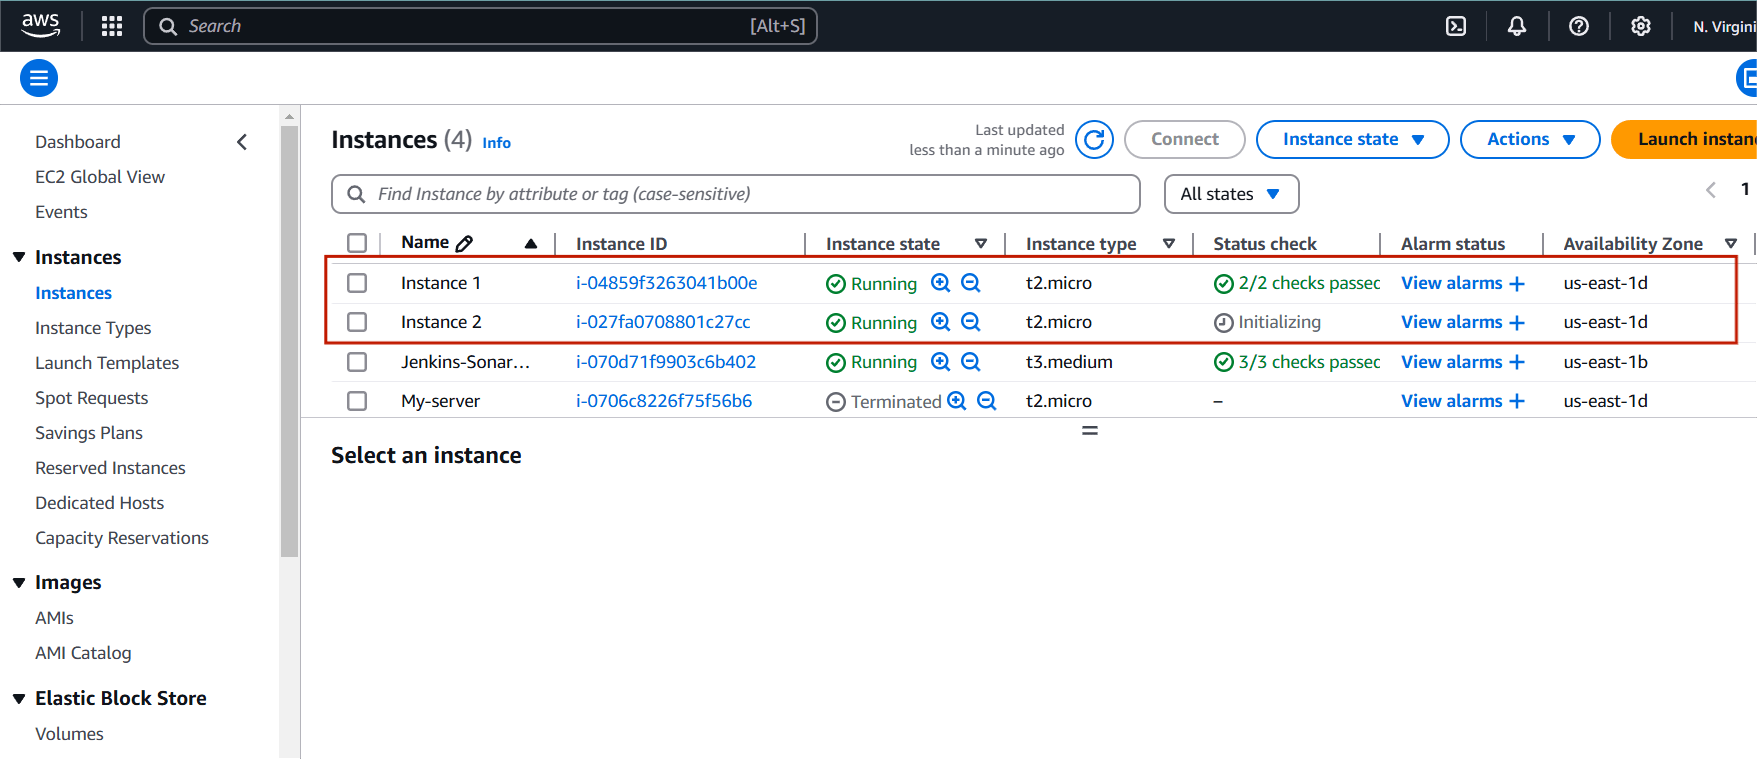
Step 1: Navigate the EC2 instance.
- You will create two instance.
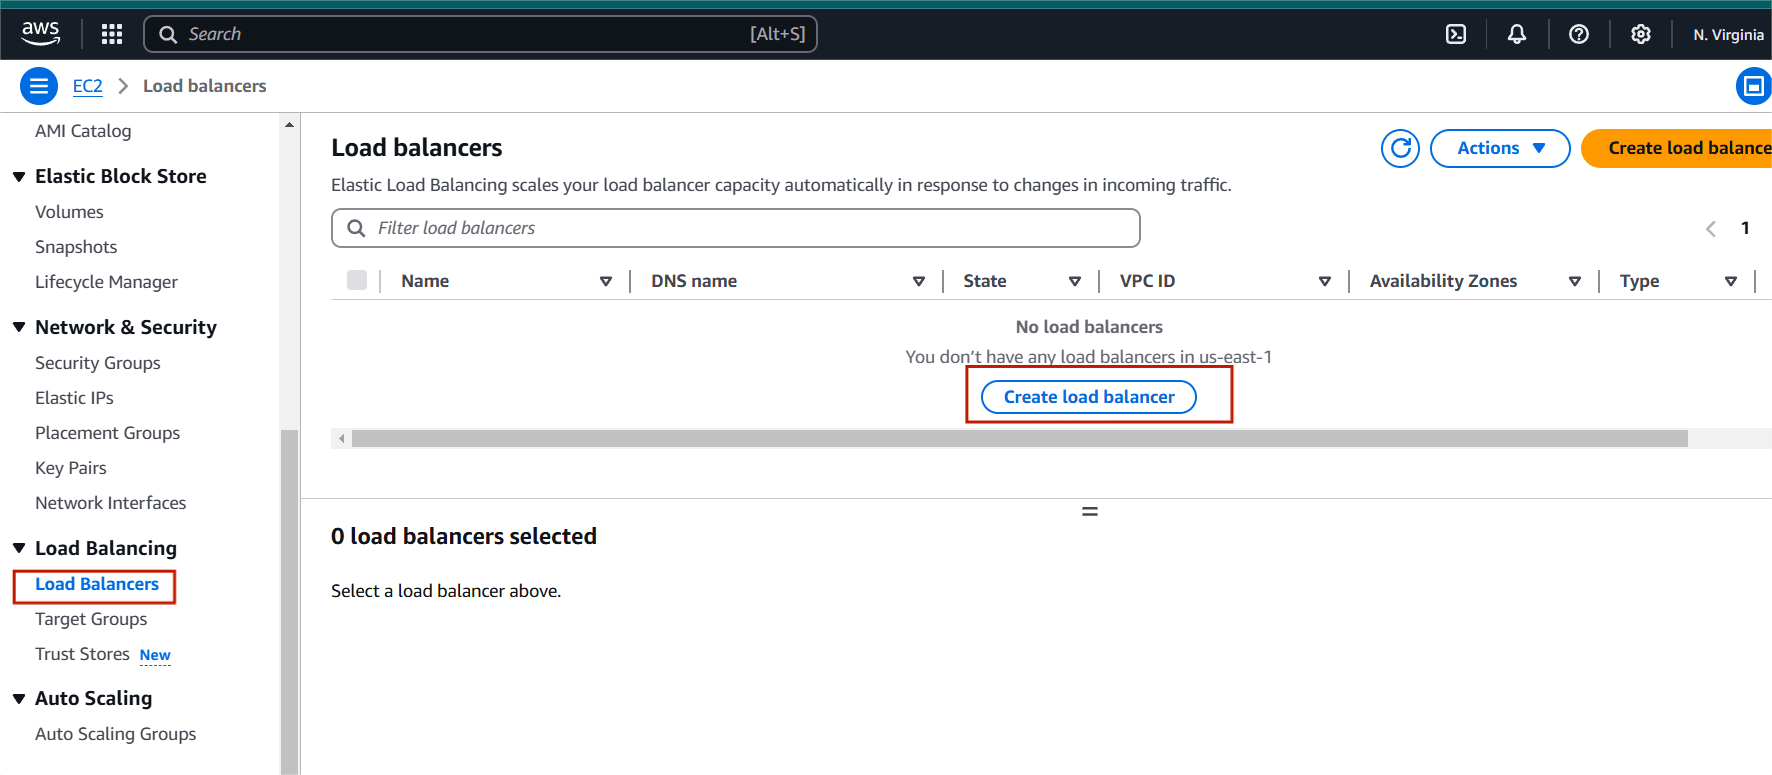
STEP 2 : Scroll down and click the Load balancer on your left side panel.
- Click create load balancer.
STEP 3: Select Application load balancer and create.
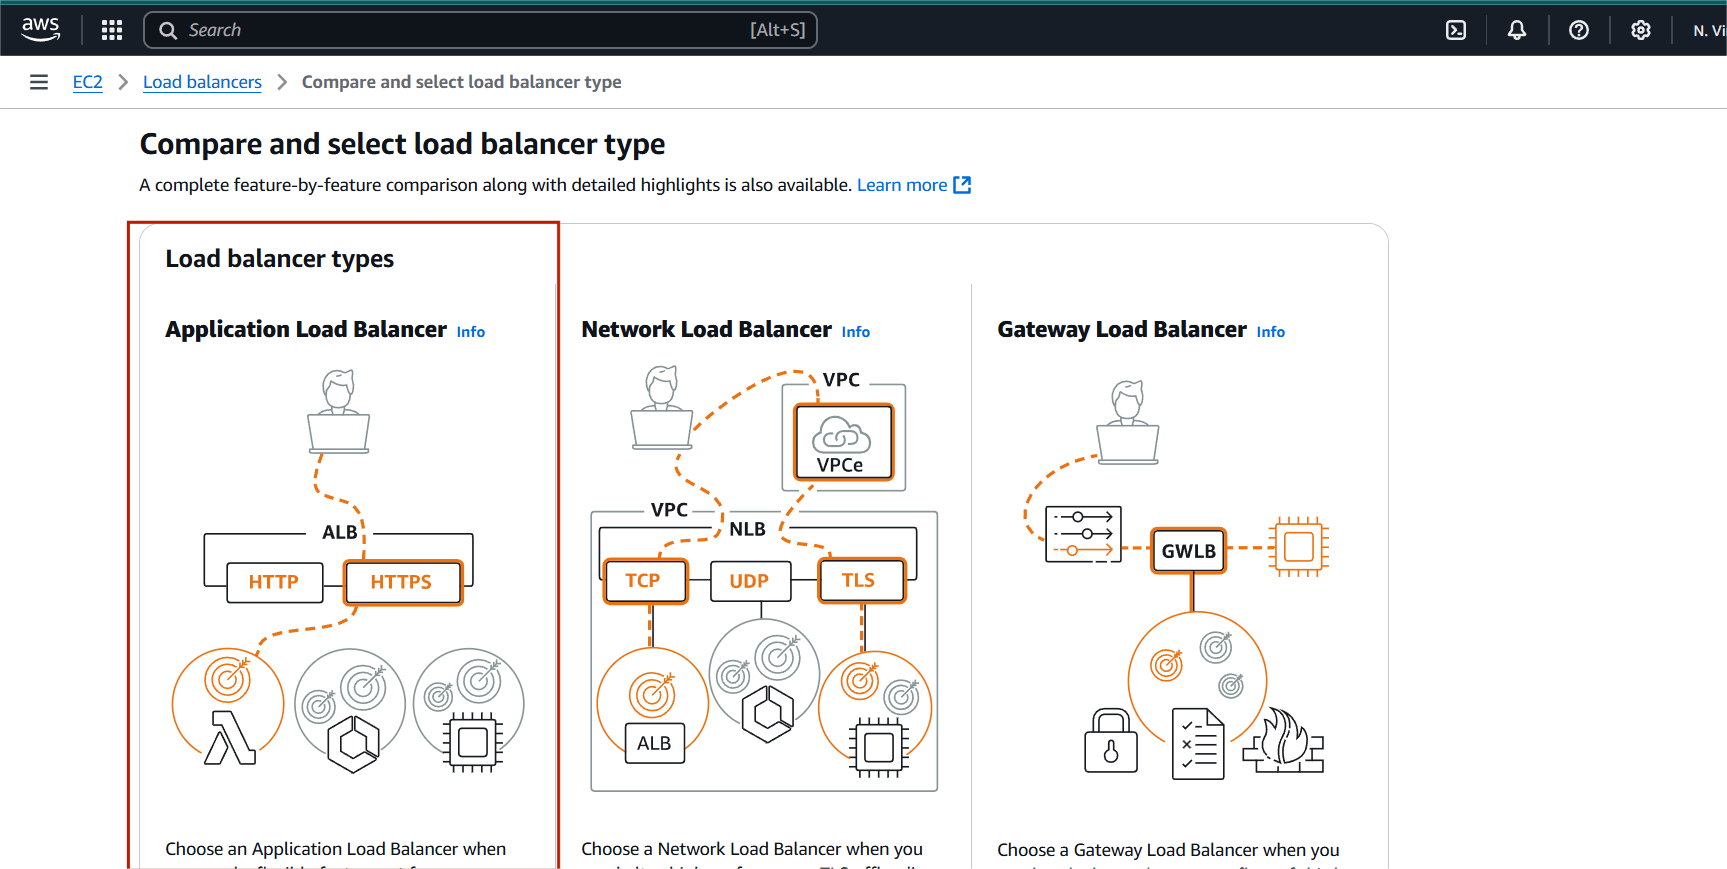
STEP 4: Enter the Load balancer name.
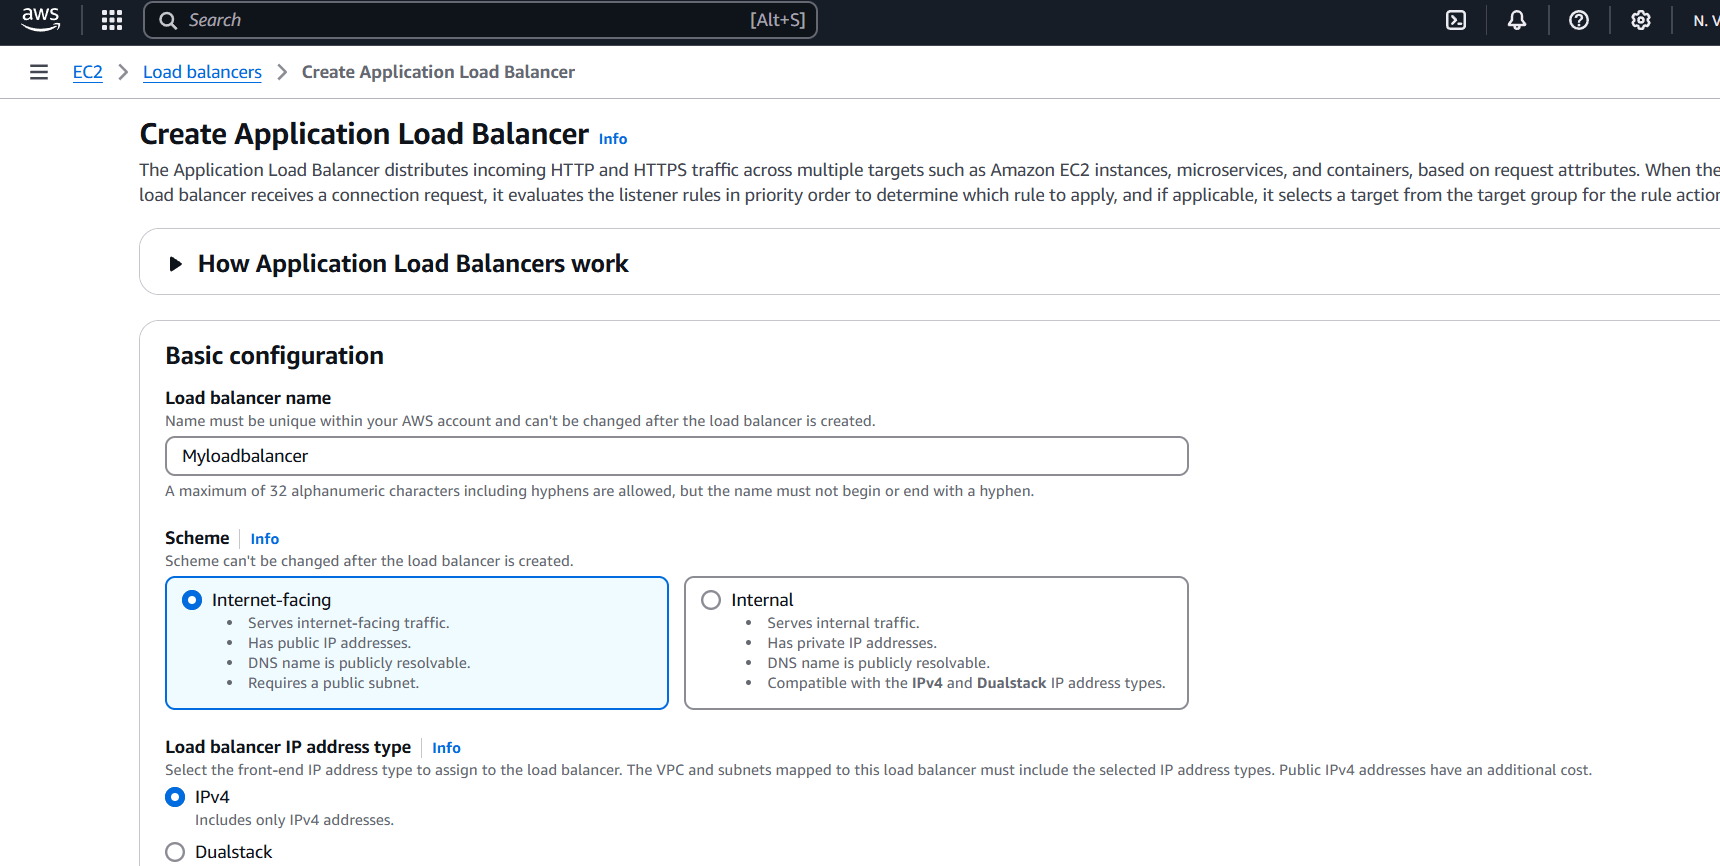
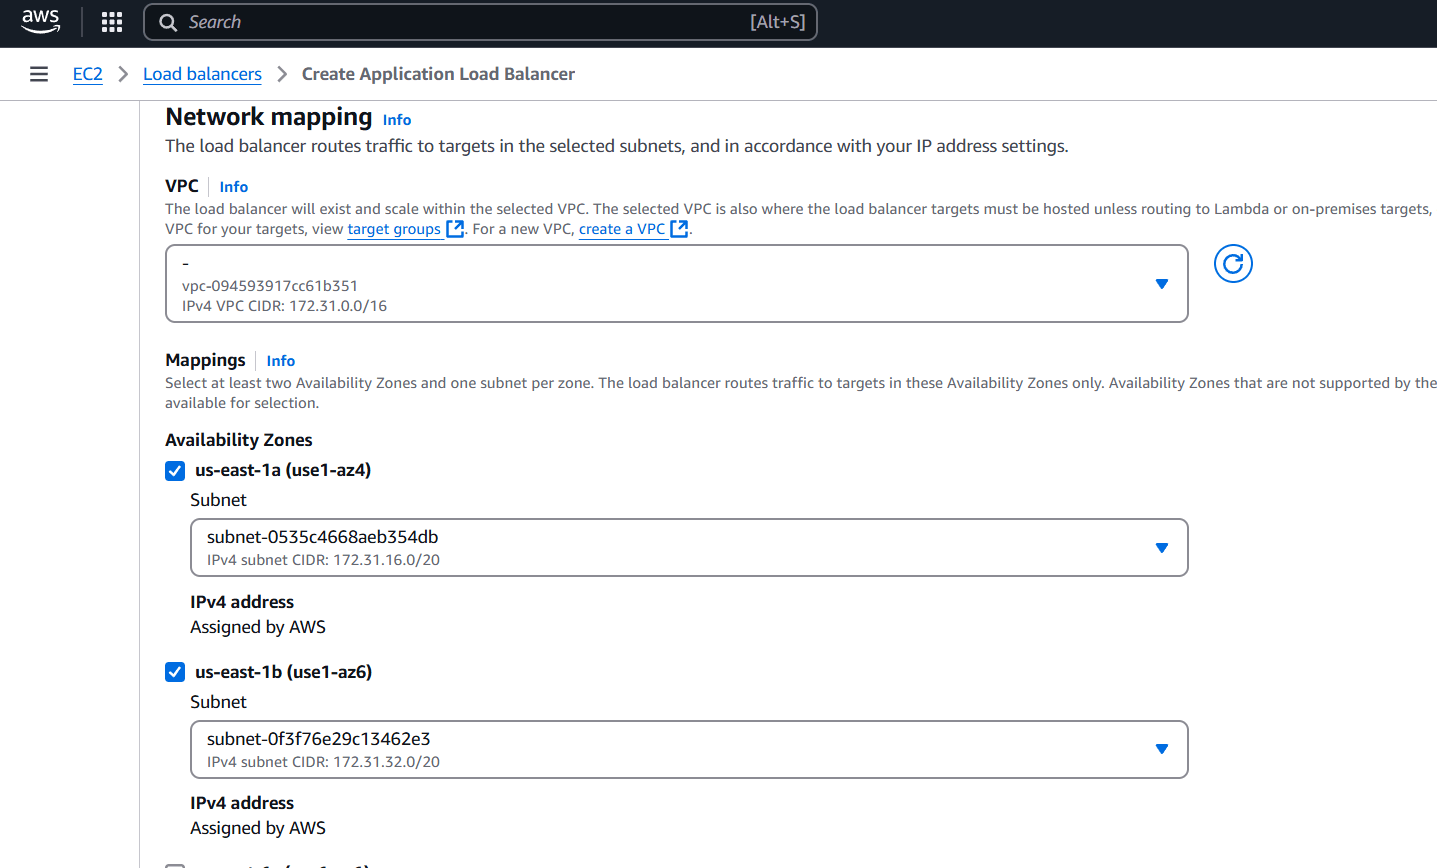
STEP 5: Select the availability zone minimum 2 subnet.
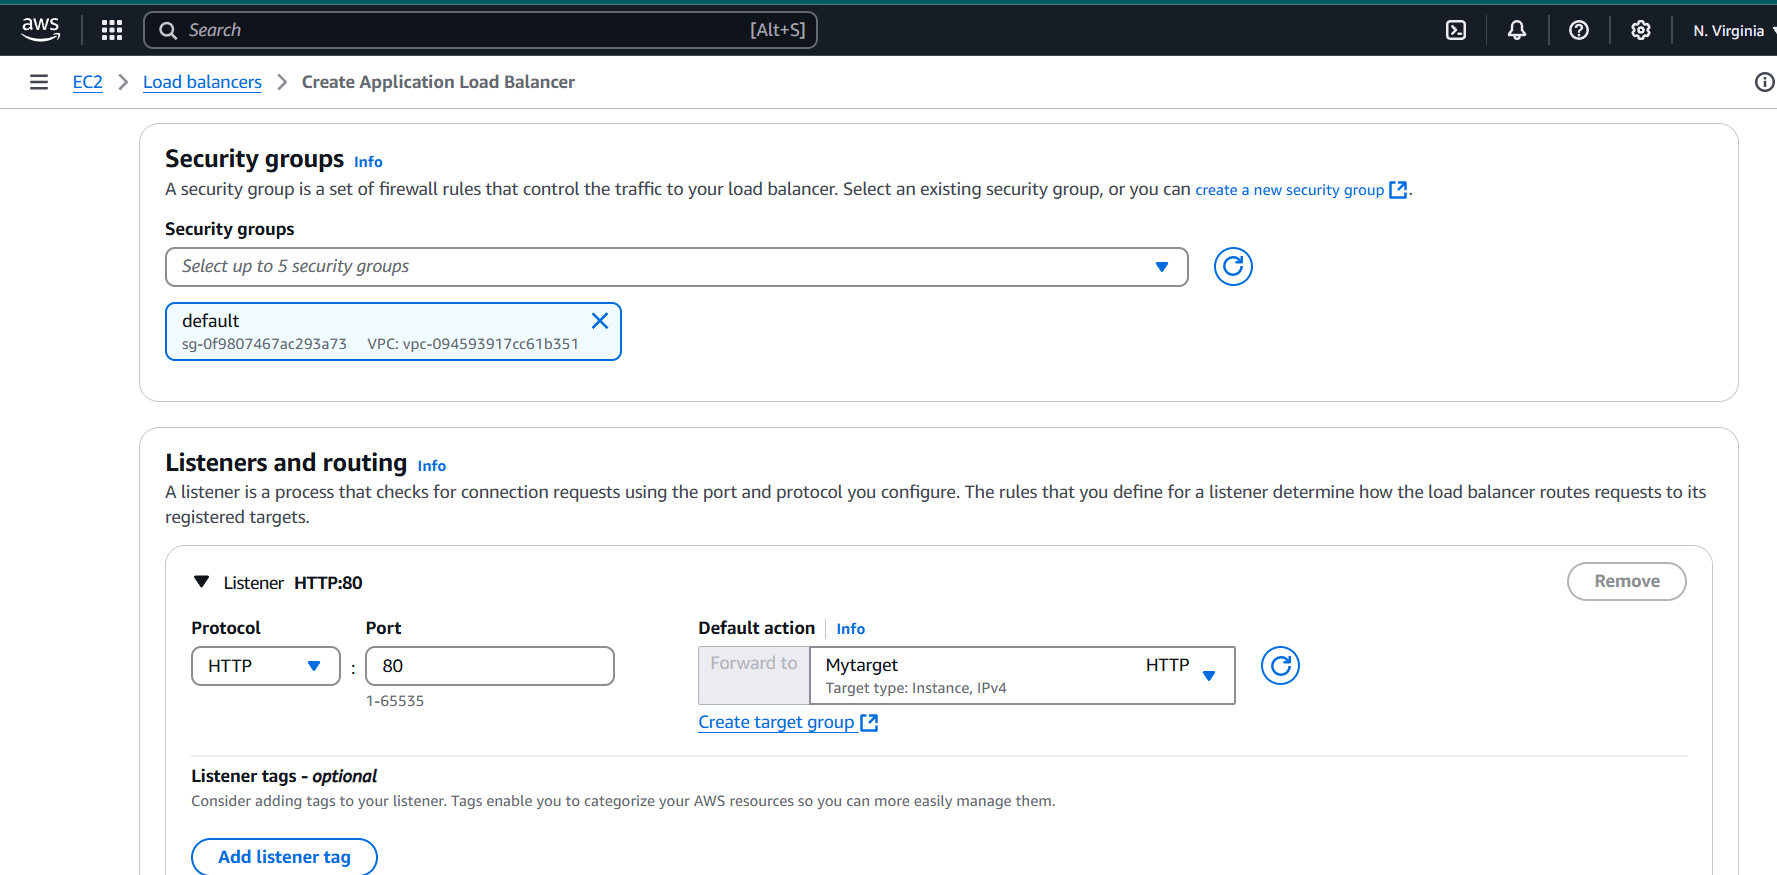
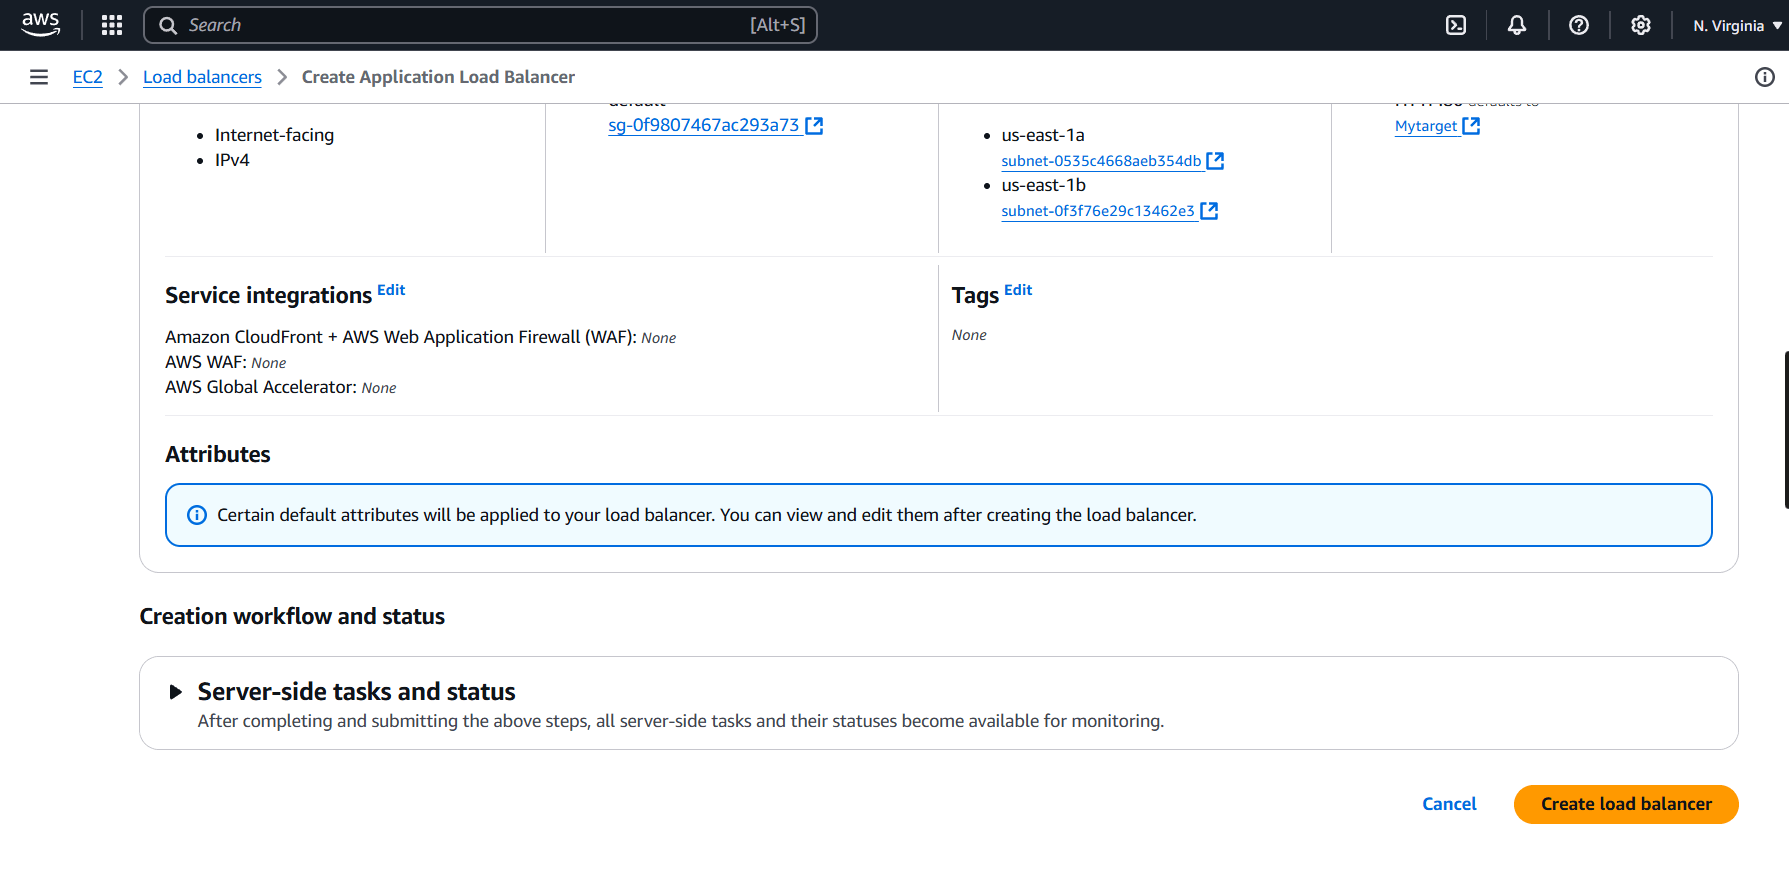
STEP 6: Select security group and target group.
STEP 7: Click on create load balancer.
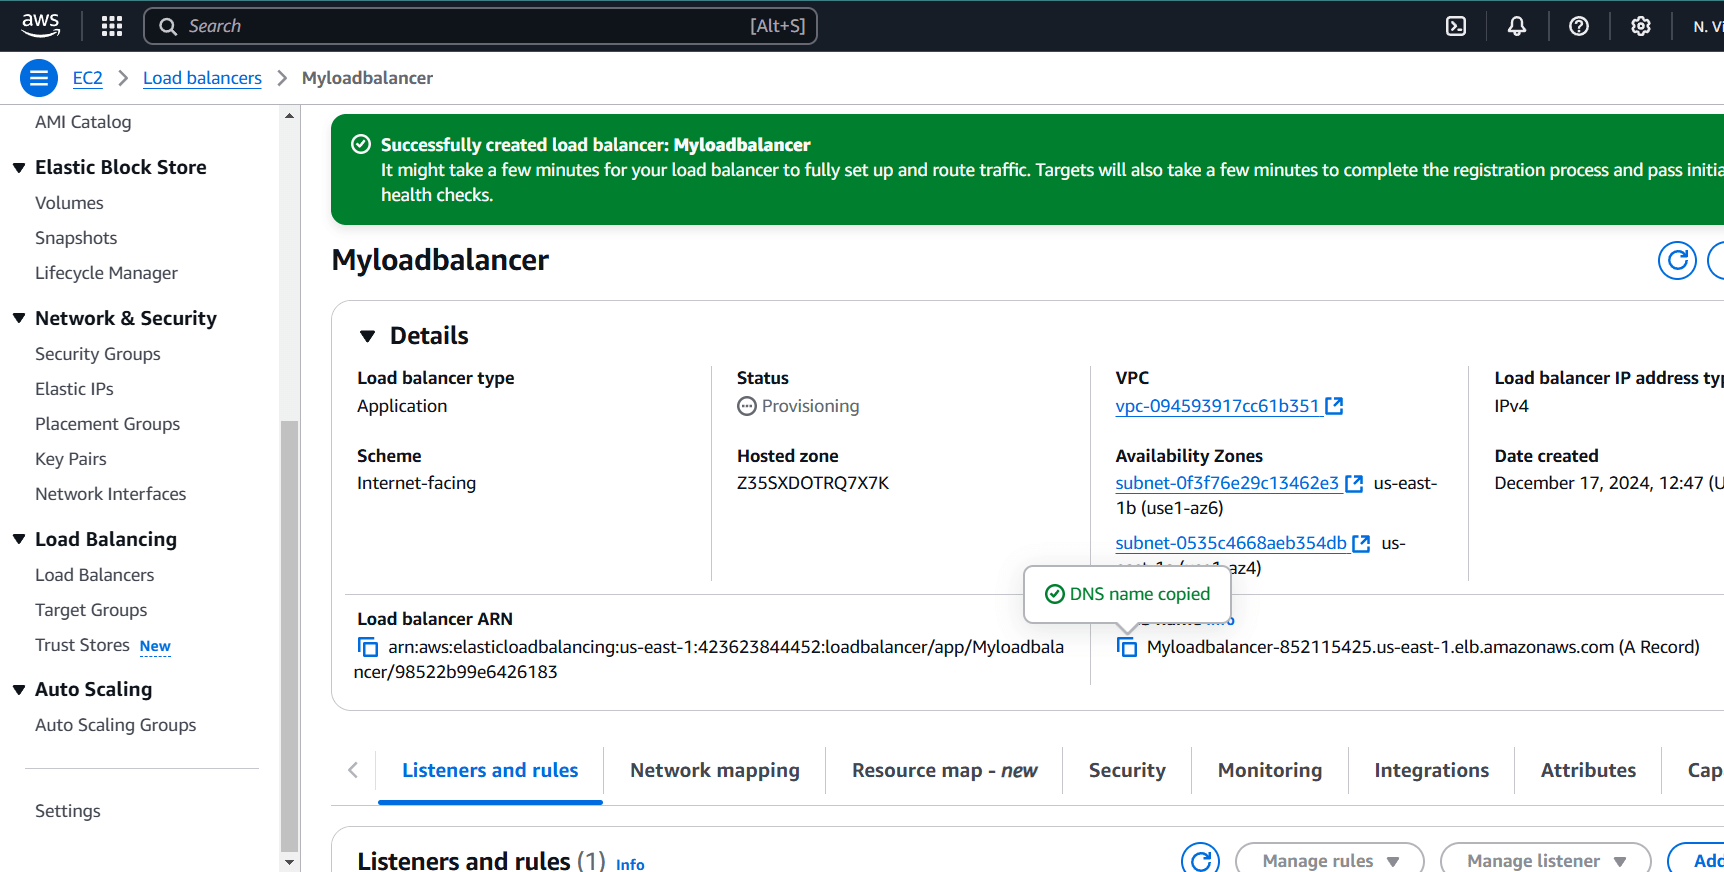
STEP 8: This highlighted part is the DNS name which when copied in the URL will host the application and will distribute the incoming traffic efficiently between the two instances.
STEP 9: This is the listener port 80 which listens to all the incoming requests


Conclusion.
In conclusion, load balancing is a critical component of modern cloud infrastructure that ensures high availability, optimal performance, and reliability for applications. Whether you’re running a small website or a large-scale distributed system, load balancing provides several key benefits that improve both the user experience and system efficiency. Load balancing allows you to seamlessly scale your infrastructure to meet varying levels of traffic. As user demand grows, you can add more servers to handle the increased load, and the load balancer will automatically distribute traffic accordingly.


