Step-by-Step: Secure API Gateway with Cognito User Pools.
Introduction.
In today’s digital landscape, security is paramount—especially when exposing APIs that serve as the backbone of mobile, web, and microservices-based applications. AWS offers a robust solution for managing API access and securing endpoints using Amazon API Gateway in conjunction with Amazon Cognito User Pools. This guide walks you step-by-step through the process of integrating these two powerful services to implement user authentication and authorization, enabling you to protect your APIs effectively. Amazon Cognito User Pools serve as a user directory that can manage sign-up and sign-in services for your applications, making it a convenient and secure way to manage identity in the AWS ecosystem. API Gateway, on the other hand, acts as a front door to your backend services, allowing you to control traffic, enforce throttling, and now—via Cognito—verify that incoming requests are from authenticated users.
When these services are used together, they provide a scalable and secure mechanism for ensuring that only valid users can access your resources. This integration means you no longer need to build and maintain your own user authentication system, reducing development overhead and security risk. In this tutorial, we will go from setting up a Cognito User Pool to creating and securing an API Gateway endpoint. You’ll learn how to configure the user pool, set up a test user, and link your API Gateway to require valid JWT tokens issued by Cognito. We’ll cover key concepts like identity tokens, authorizers, scopes, and OAuth 2.0 flows. Whether you’re developing a serverless application, a REST API, or a backend for your mobile app, securing it with Cognito and API Gateway ensures only authenticated users can interact with your services.
We will also walk through testing the integration using tools like Postman and AWS CLI, debugging common errors, and managing user permissions using Cognito groups. Additionally, you’ll understand how to configure token expiration and refresh, to keep your user experience seamless while maintaining robust security. By the end of this guide, you’ll have a working example of a secure API that authenticates users via Cognito, issues tokens, and validates those tokens before granting access to your API. This method is not only secure but also aligns well with modern cloud-native design principles, ensuring your architecture is both resilient and scalable. Whether you’re new to AWS or an experienced developer, this step-by-step walkthrough will give you a practical foundation for implementing secure, authenticated API access using AWS services. Let’s dive in and start building a secure API gateway with Cognito User Pools.

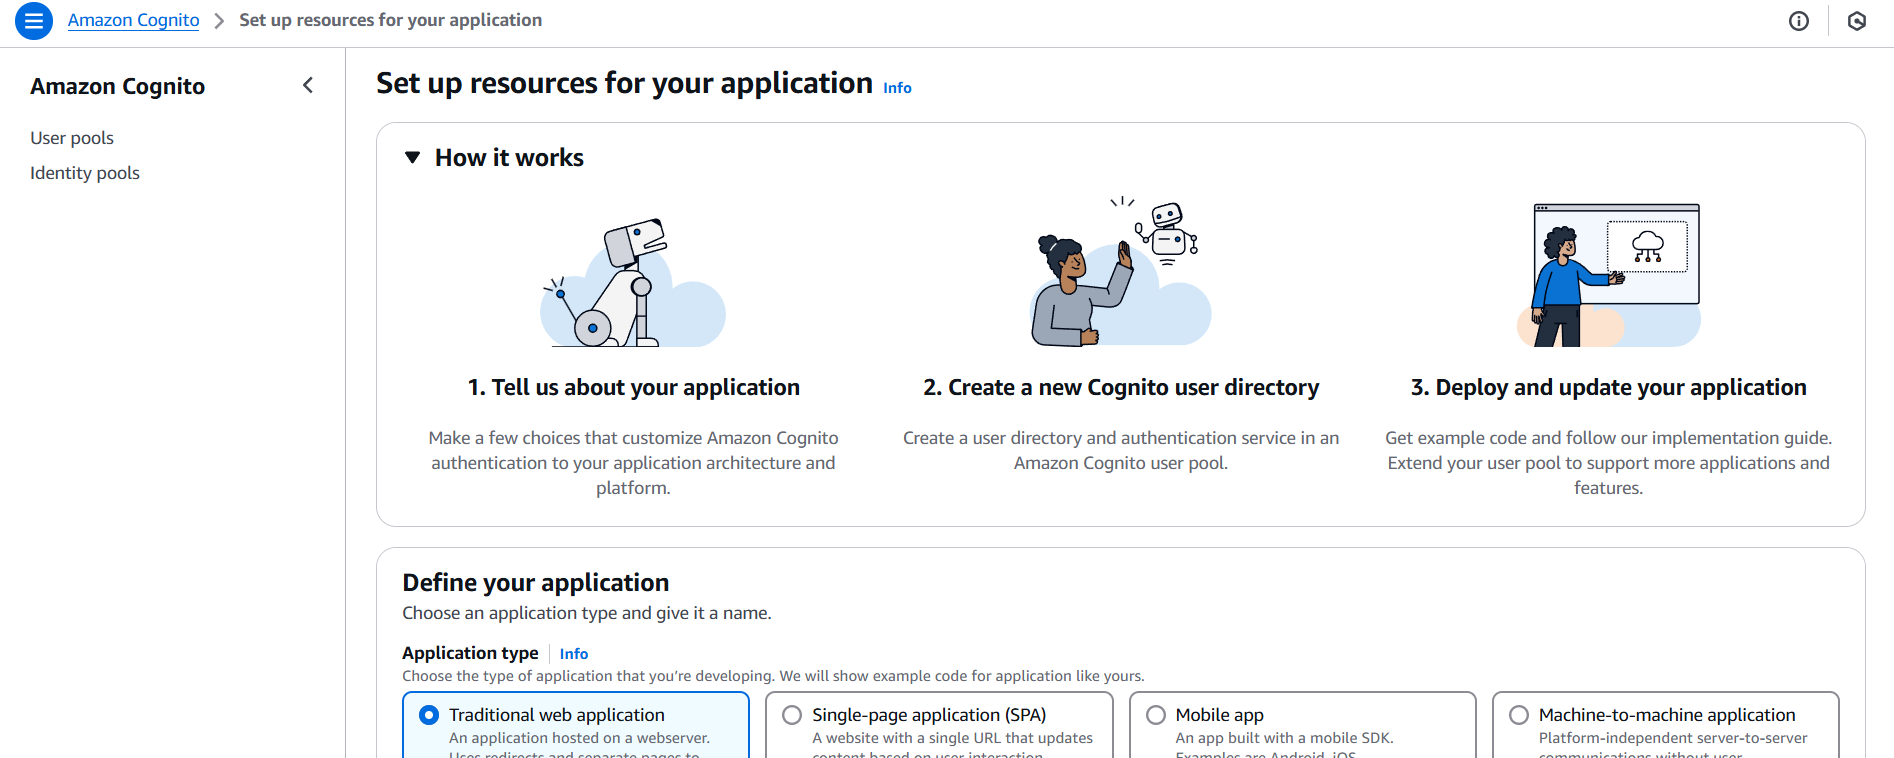
1. Create a Cognito User Pool
- Go to the Cognito console.
- Choose “Create user pool”.
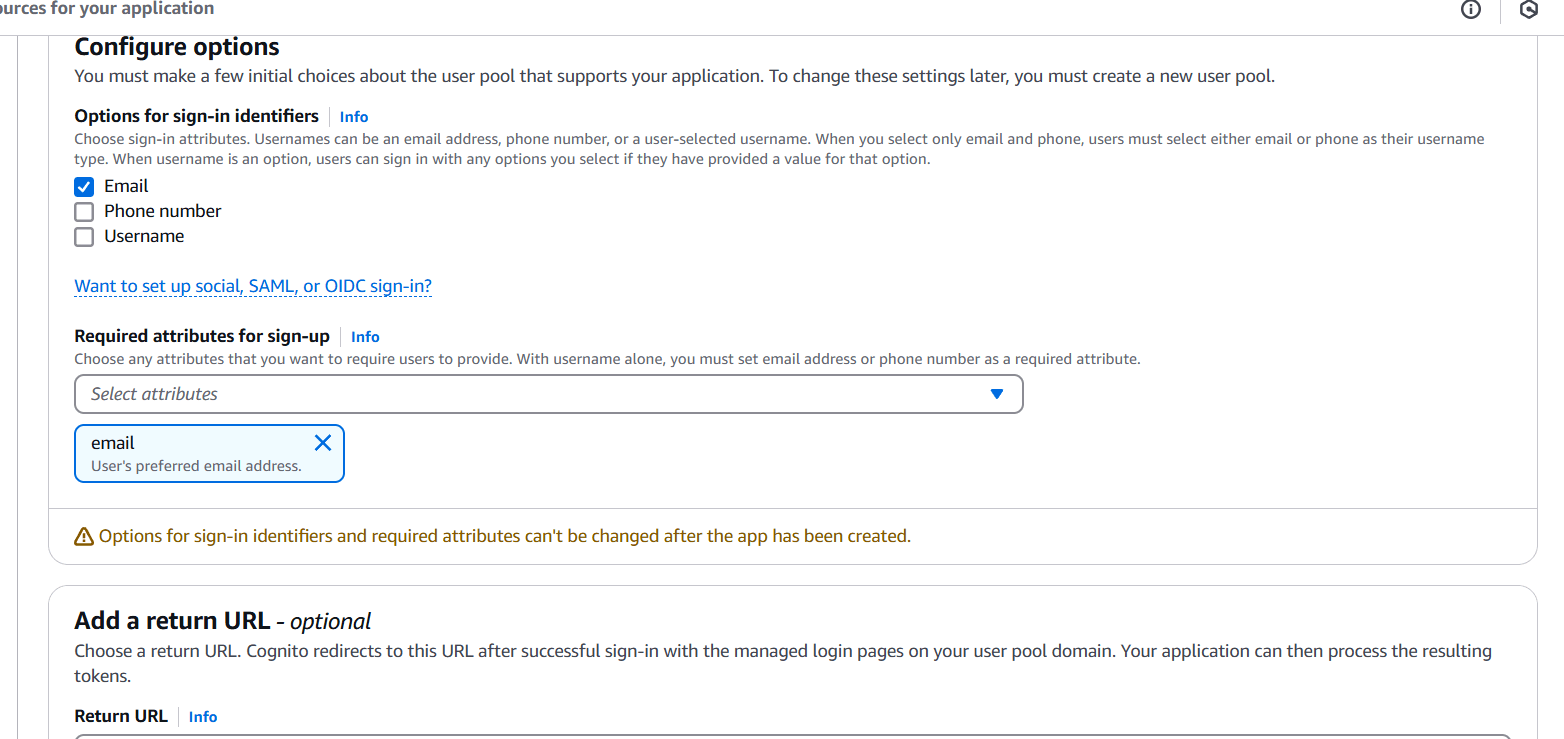
- Configure the settings:
- Pool name, password policy, sign-in options (e.g., email, username).
- Create an App Client (no client secret required if using JavaScript).
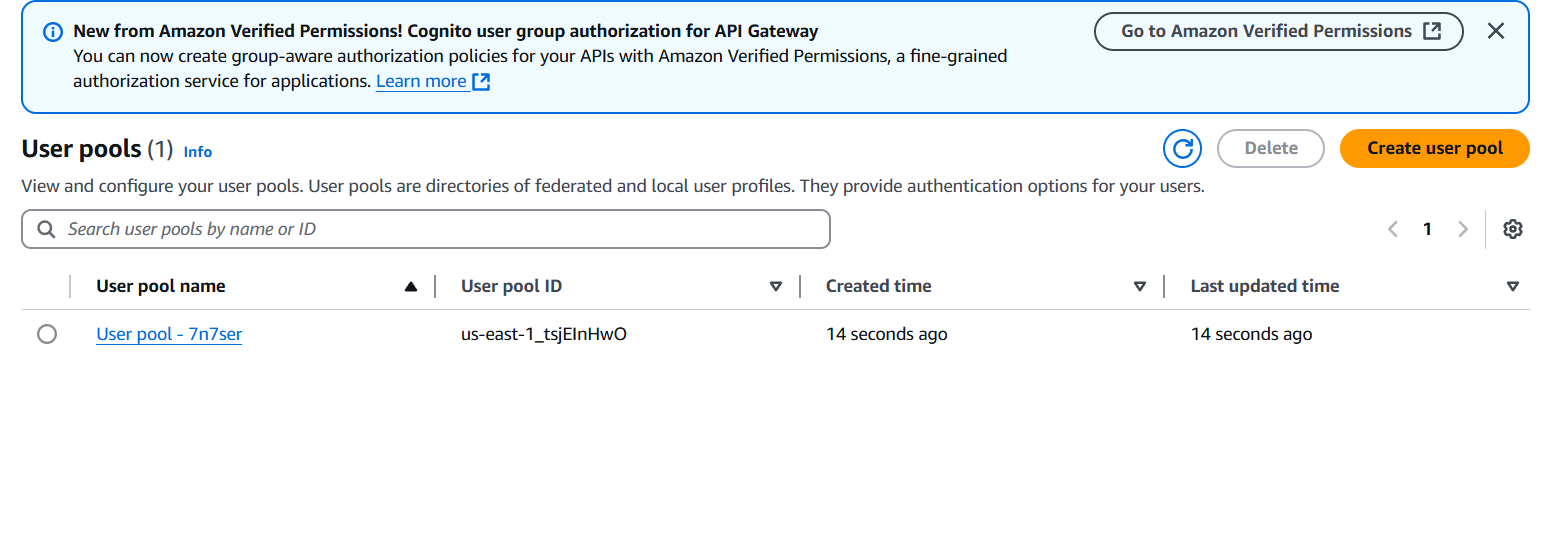
- Note the User Pool ID and App Client ID.


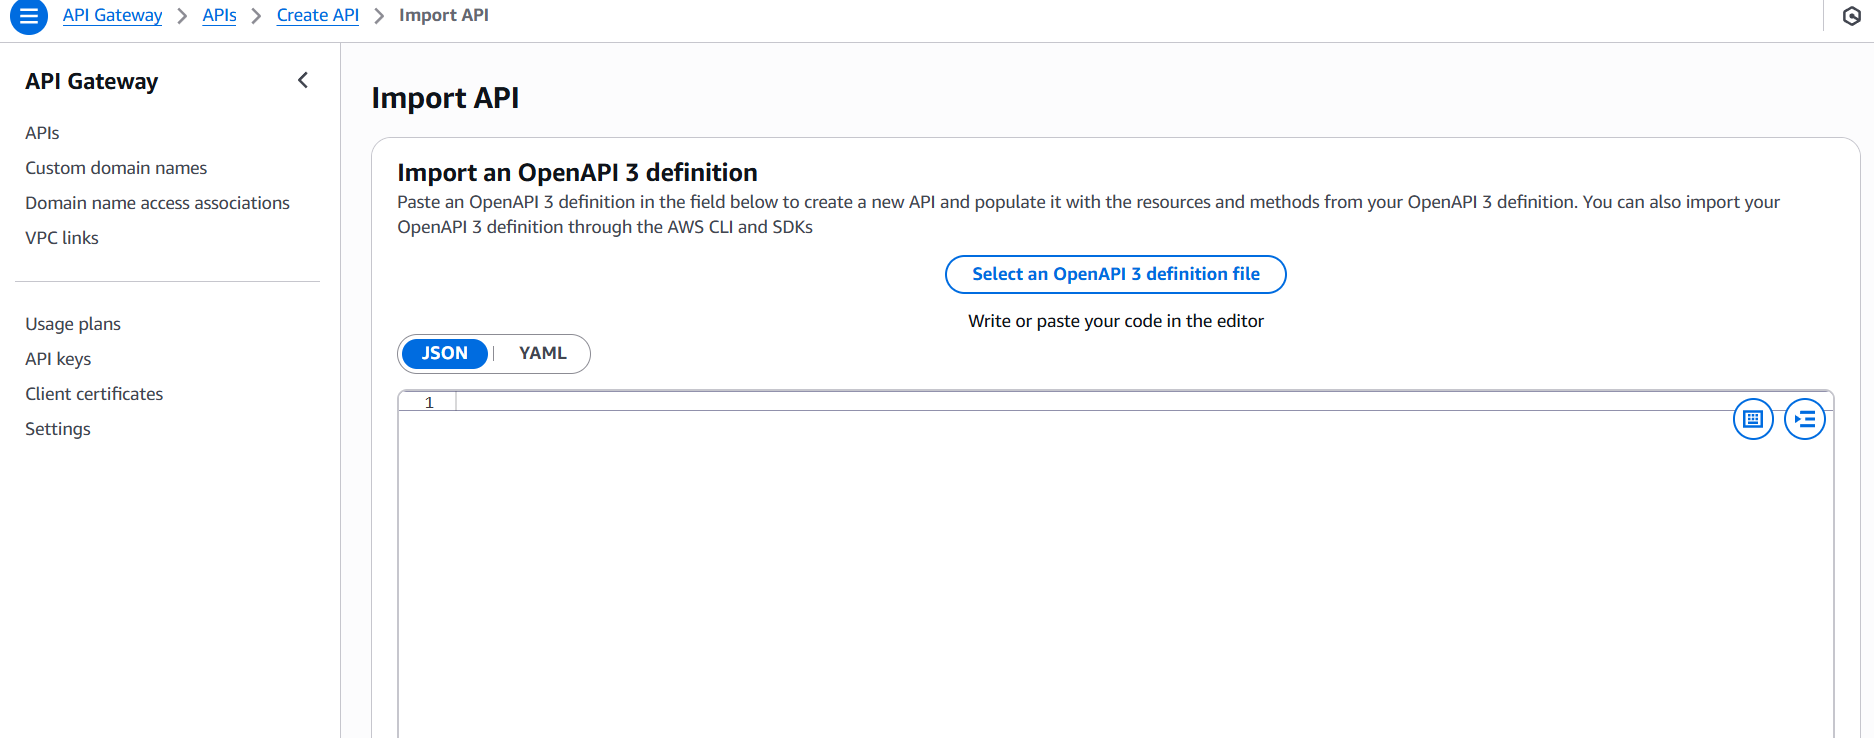
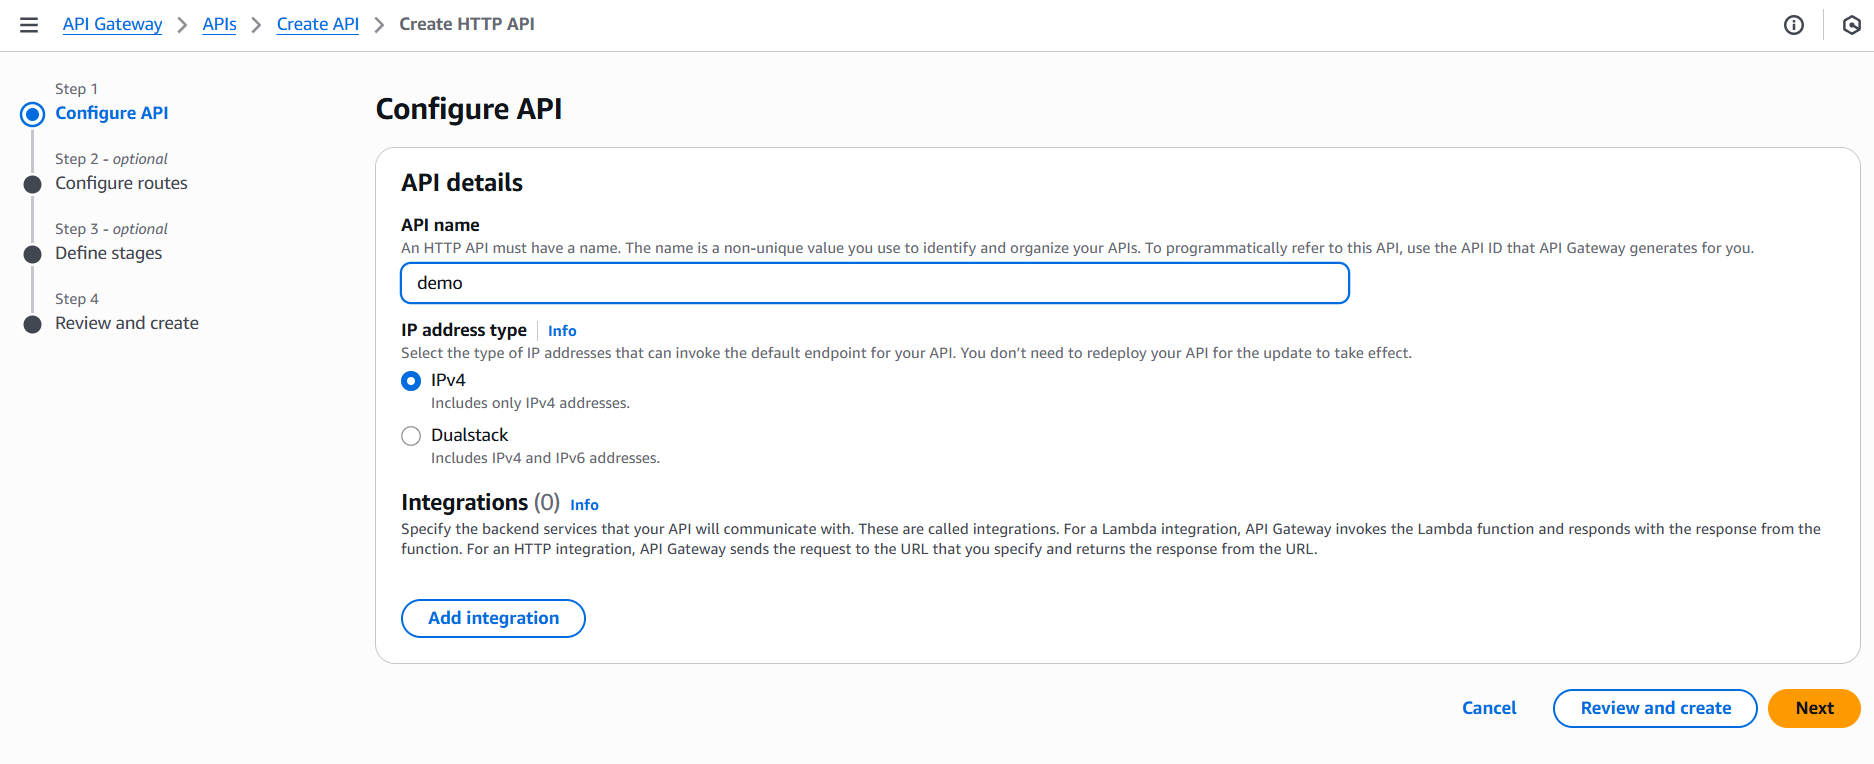
2. Create an API in API Gateway
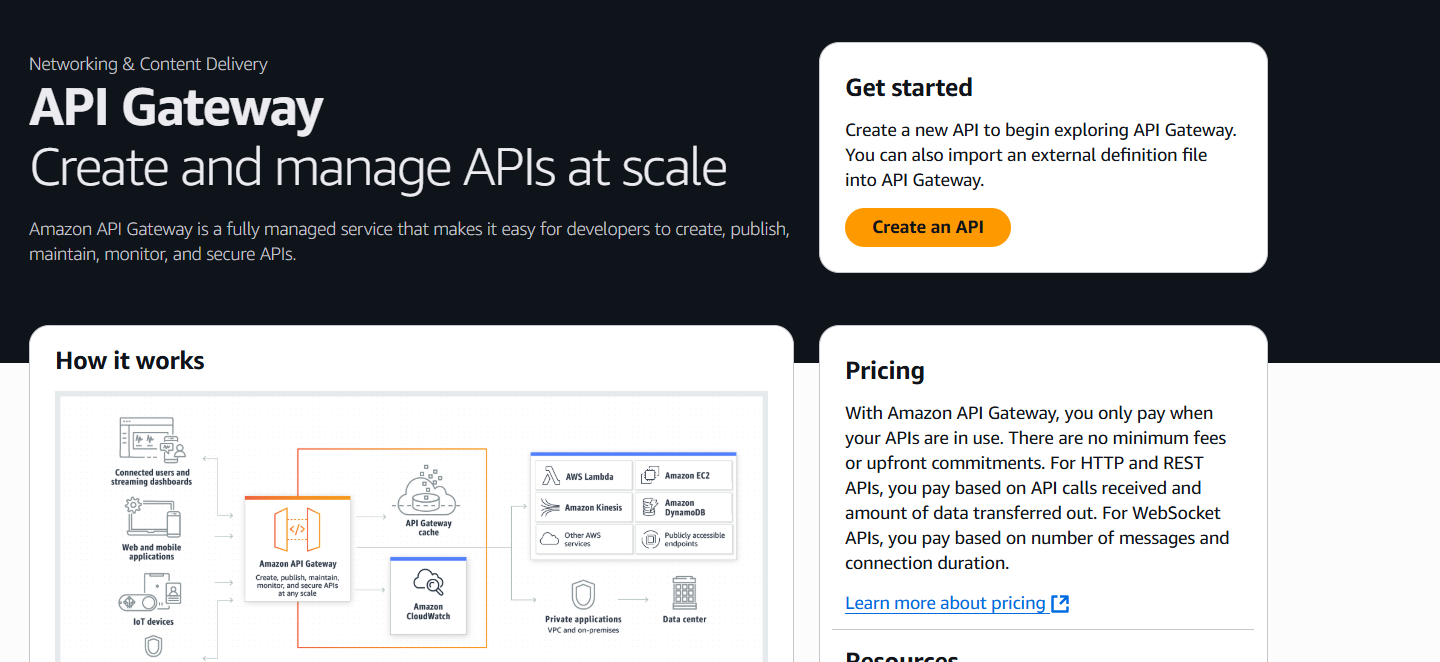
- Go to the API Gateway console.
- Choose Create API → HTTP API or REST API.
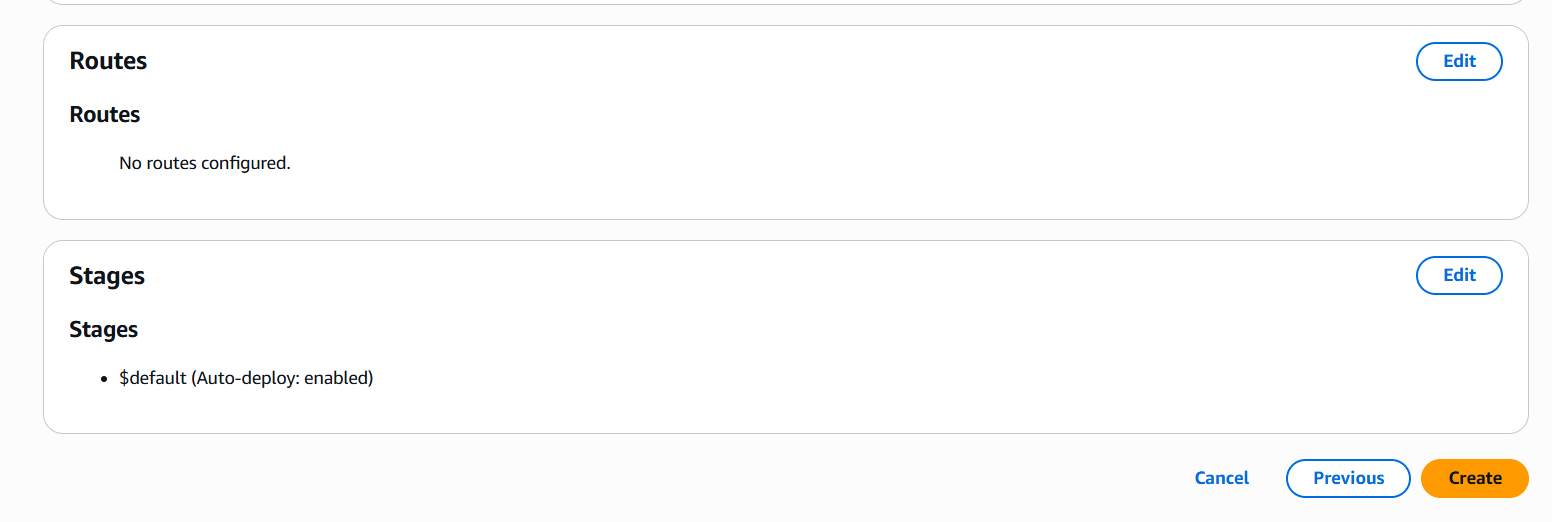
- Configure your routes and integration (Lambda, HTTP backend, etc.).
3. Add an Authorizer
For HTTP APIs:
- Under your API, go to “Authorization”.
- Choose “Add authorizer” → Select Cognito.
- Enter:
- A name for the authorizer.
- Select your Cognito User Pool and App Client.
- Enable JWT token validation using the issuer URL:
https://cognito-idp.<region>.amazonaws.com/<userPoolId>
For REST APIs:
- Go to Authorizers → Create new authorizer.
- Choose type: Cognito.
- Enter:
- Name, Cognito User Pool, and Token Source (usually
Authorizationheader).
- Name, Cognito User Pool, and Token Source (usually
- Save the authorizer.
4. Secure Your Routes
- For HTTP APIs:
- Go to Routes → select the route.
- Under Authorization, select your Cognito authorizer.
- For REST APIs:
- Go to your Method Request → Enable Authorization → Select the Cognito Authorizer.





5. Test Authentication
- Use AWS Amplify or Cognito SDK to sign in a user and get a JWT token.
- Send an HTTP request to your API Gateway with the token:
GET /your-api-endpoint
Host: your-api-id.execute-api.region.amazonaws.com
Authorization: eyJraWQiOiJrZXlfaWQiLCJhbGciOi...

Conclusion.
Securing your APIs is no longer a luxury—it’s a necessity. By integrating Amazon API Gateway with Cognito User Pools, you’ve learned how to implement a secure and scalable authentication mechanism that protects your backend services from unauthorized access. This approach leverages AWS-managed identity services, reducing the complexity of building and maintaining your own user management and token validation systems. Through this step-by-step process, you configured a Cognito User Pool, created and tested a user, established an API Gateway with a Cognito authorizer, and verified token-based access control. You’ve seen how this setup not only enhances security but also supports modern authentication flows such as OAuth 2.0 and JWT, making it ideal for both web and mobile applications. As your application grows, you can build on this foundation—adding features like multi-factor authentication (MFA), custom user attributes, and fine-grained access control using Cognito groups and IAM roles. In adopting this solution, you’re following best practices in cloud security and creating a future-proof API infrastructure. With your secure API in place, you’re now well-equipped to support user-authenticated, scalable, and compliant applications on AWS.
Set Up AWS EKS with Terraform and Access It via kubectl.
Introduction.
Setting up a Kubernetes environment on AWS might seem daunting at first—but thanks to Amazon EKS (Elastic Kubernetes Service) and infrastructure-as-code tools like Terraform, it’s now easier, faster, and more reliable than ever. In this guide, we’ll walk you through the full process of provisioning a highly available EKS cluster and installing kubectl, the Kubernetes command-line tool, using Terraform. Whether you’re a DevOps engineer, a cloud developer, or simply someone exploring container orchestration, this tutorial will help you get a working EKS setup with minimal manual intervention.
Amazon EKS provides a managed Kubernetes service that takes care of control plane provisioning, scaling, and management, while still giving you the flexibility to configure worker nodes and networking. It is tightly integrated with other AWS services, including IAM for authentication, CloudWatch for logging, and VPC for networking. But despite its convenience, configuring EKS by hand can be time-consuming and error-prone—especially in production environments where repeatability and consistency are crucial.
This is where Terraform comes in. As an open-source infrastructure-as-code tool developed by HashiCorp, Terraform allows you to define cloud resources declaratively in configuration files. By using Terraform to manage EKS, you can version control your infrastructure, reuse code through modules, and automate cluster provisioning with confidence. You can also tear down and recreate environments quickly, making it ideal for both development and testing.
In this tutorial, we’ll start by configuring Terraform to work with AWS. We’ll create a VPC, subnets, and an EKS cluster using community-supported Terraform modules. Then we’ll install kubectl, configure it to communicate with our new cluster, and run basic commands to verify everything works. You’ll learn how to structure your Terraform files, how to manage variables and outputs, and how to avoid common pitfalls.
Even if you’re new to Kubernetes or Terraform, this guide is beginner-friendly and explains each concept along the way. We’ll also highlight best practices, such as using separate files for providers, variables, and outputs, and organizing your infrastructure into reusable modules. You’ll end up with a fully functional Kubernetes environment that’s cloud-native, scalable, and ready for deploying real-world applications.
So if you’re ready to stop clicking through the AWS console and start automating your infrastructure the DevOps way, let’s dive into creating an Amazon EKS cluster with Terraform and managing it effortlessly using kubectl.

Prerequisites
- AWS CLI installed and configured (
aws configure) - Terraform installed
- IAM user/role with permissions for EKS
kubectl(installed via Terraform if needed)- An S3 bucket and DynamoDB table for Terraform state (recommended for production)
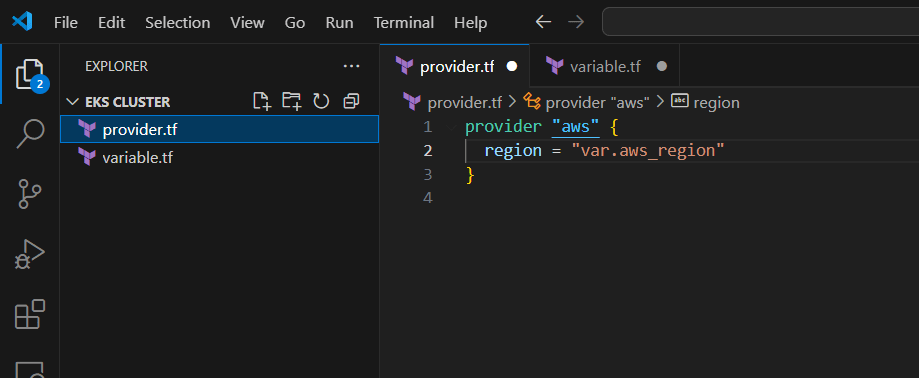
provider.tf
provider "aws" {
  region = var.aws_region
}
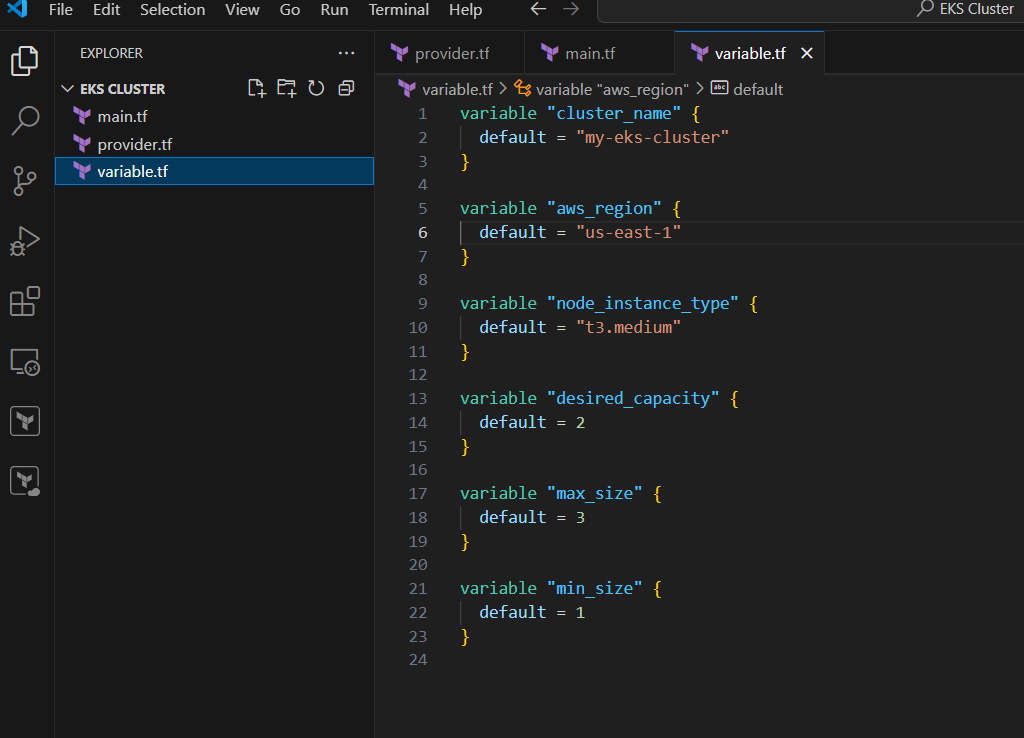
variables.tf
variable "cluster_name" {
  default = "my-eks-cluster"
}

variable "aws_region" {
  default = "us-west-2"
}

variable "node_instance_type" {
  default = "t3.medium"
}

variable "desired_capacity" {
  default = 2
}

variable "max_size" {
  default = 3
}

variable "min_size" {
  default = 1
}
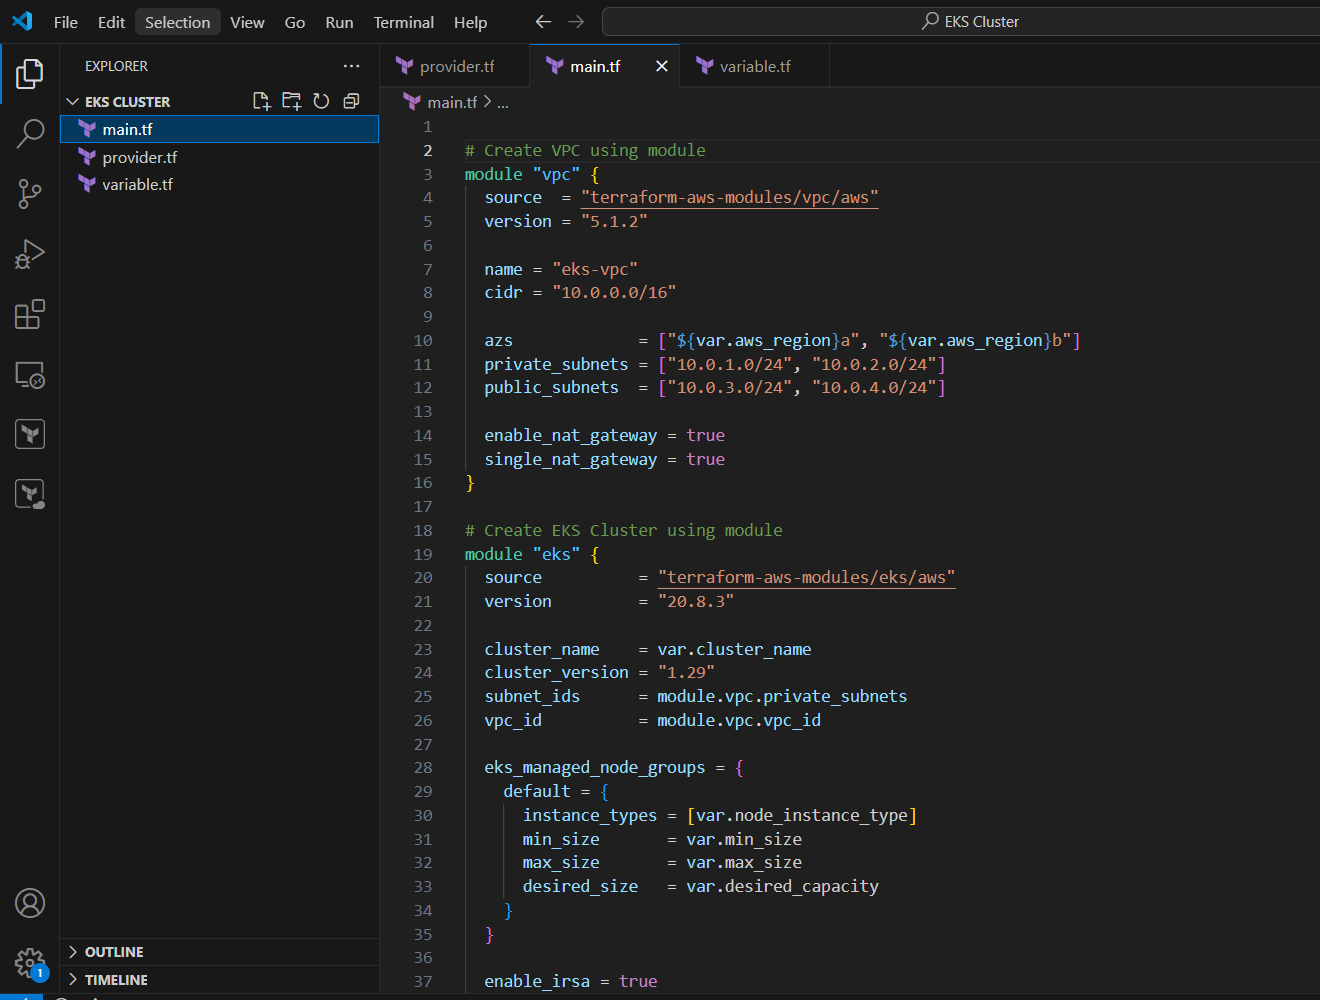
main.tf
# Create VPC using module
module "vpc" {
  source  = "terraform-aws-modules/vpc/aws"
  version = "5.1.2"

  name = "eks-vpc"
  cidr = "10.0.0.0/16"

  azs             = ["${var.aws_region}a", "${var.aws_region}b"]
  private_subnets = ["10.0.1.0/24", "10.0.2.0/24"]
  public_subnets  = ["10.0.3.0/24", "10.0.4.0/24"]

  enable_nat_gateway = true
  single_nat_gateway = true
}

# Create EKS Cluster using module
module "eks" {
  source          = "terraform-aws-modules/eks/aws"
  version         = "20.8.3"

  cluster_name    = var.cluster_name
  cluster_version = "1.29"
  subnet_ids      = module.vpc.private_subnets
  vpc_id          = module.vpc.vpc_id

  eks_managed_node_groups = {
    default = {
      instance_types = [var.node_instance_type]
      min_size       = var.min_size
      max_size       = var.max_size
      desired_size   = var.desired_capacity
    }
  }

  enable_irsa = true
}
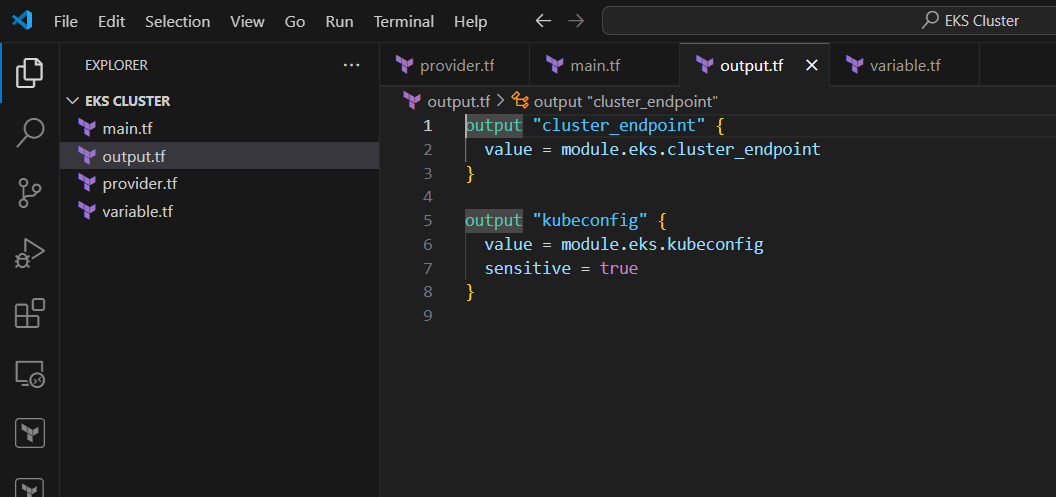
outputs.tf
output "cluster_endpoint" {
  value = module.eks.cluster_endpoint
}

output "kubeconfig" {
  value = module.eks.kubeconfig
  sensitive = true
}
Install kubectl Using Terraform (Optional)
If you want to install kubectl via Terraform, use the null_resource + local-exec provisioner:
resource "null_resource" "install_kubectl" {
  provisioner "local-exec" {
    command = <<EOT
      curl -o kubectl https://s3.us-west-2.amazonaws.com/amazon-eks/1.29.0/2024-03-27/bin/linux/amd64/kubectl
      chmod +x ./kubectl
      sudo mv ./kubectl /usr/local/bin/
    EOT
  }
}
Deploy Steps
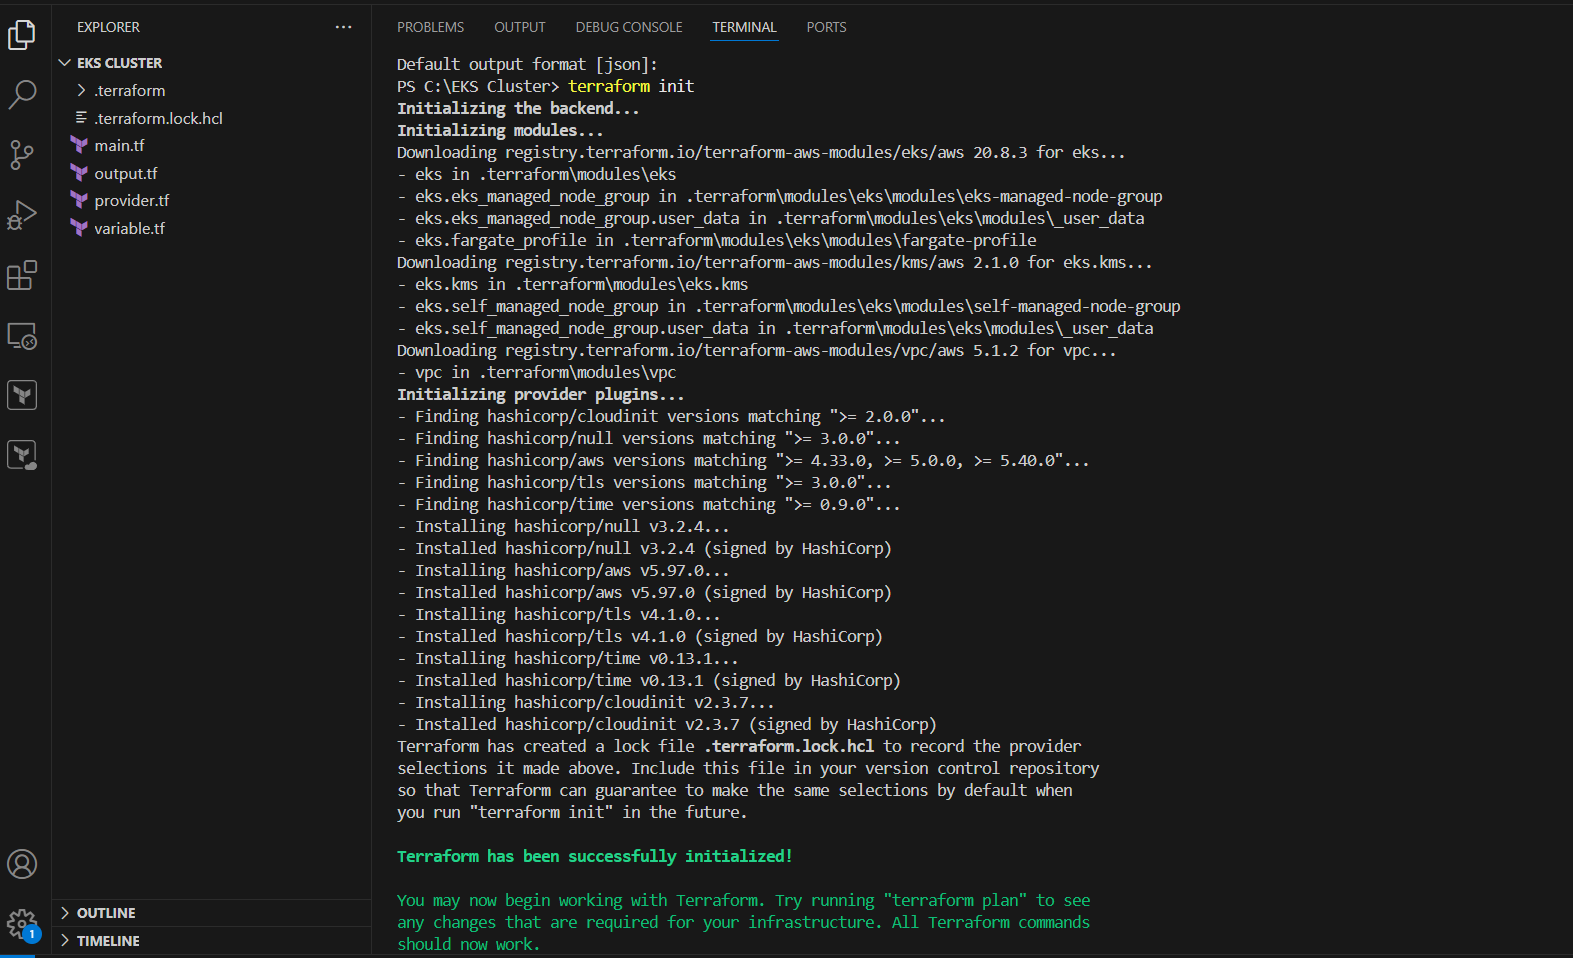
terraform init
terraform apply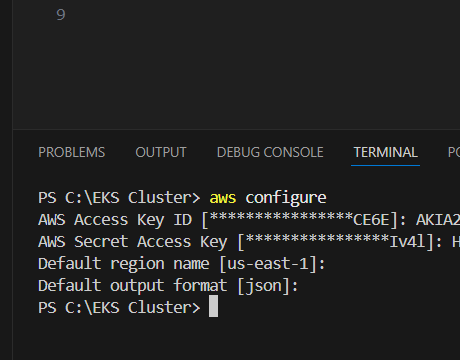


Conclusion.
In conclusion, provisioning an Amazon EKS cluster using Terraform and configuring kubectl is a powerful way to automate and simplify your Kubernetes infrastructure on AWS. With just a few well-structured configuration files, you can define, deploy, and manage a highly available Kubernetes environment that integrates seamlessly with the rest of your cloud ecosystem. This approach not only reduces manual errors but also makes your infrastructure reproducible, version-controlled, and easier to manage in the long term. Whether you’re building a development environment, staging cluster, or a full production setup, Terraform and kubectl together give you the control and flexibility needed to operate confidently at scale. As you grow more comfortable with this setup, you can extend it further—adding monitoring tools, CI/CD pipelines, and security policies—all within the same infrastructure-as-code workflow. By embracing automation and best practices early, you’re setting your Kubernetes journey on a solid and scalable foundation.
Hands-On AWS Security: Spot Sensitive Data in S3 Buckets Using Macie.
Introduction.
In today’s digital era, data has become one of the most valuable assets for businesses of all sizes. With the rise of cloud computing, particularly Amazon Web Services (AWS), storing vast amounts of data in the cloud has become more convenient than ever. Among AWS’s most popular services, Amazon S3 (Simple Storage Service) stands out as a widely used solution for storing objects and files. While this convenience is a game-changer, it also introduces significant risks—especially when it comes to the storage of sensitive data. Sensitive information such as personally identifiable information (PII), financial data, credentials, or proprietary business content may accidentally be left unprotected or misclassified in S3 buckets.
The consequences of exposing such data can be severe: data breaches, compliance violations, reputational damage, and financial penalties. Regulations such as GDPR, HIPAA, and CCPA demand strict protection of customer and business data. Yet, in large-scale cloud environments, it becomes increasingly difficult to maintain visibility into exactly what data resides where—and whether it’s at risk. That’s where Amazon Macie steps in.
Amazon Macie is a fully managed data security and data privacy service offered by AWS. It uses machine learning and pattern matching to automatically discover and classify sensitive data within S3 buckets. Macie helps organizations identify where their sensitive data lives, how it’s being accessed, and whether it’s properly protected. It not only scans and reports on the presence of sensitive information but also provides actionable insights that allow security teams to remediate issues before they become breaches.
In this challenge, we will walk through the process of using Amazon Macie to discover sensitive data stored in S3 buckets. Whether you’re a cloud security engineer, DevOps professional, or just an AWS learner, this guide is designed to provide hands-on experience with Macie and its powerful classification features. We will begin by setting up Macie in the AWS Management Console, configuring a classification job, and analyzing the results. This real-world challenge mirrors scenarios that professionals face when securing cloud environments, making it both an educational and practical exercise.
This walkthrough will demonstrate how easy it is to activate Macie, scan your environment, and interpret its findings. By the end of this challenge, you’ll gain a clear understanding of how Macie works, why it’s crucial for cloud security, and how it fits into a broader strategy for securing sensitive data in the cloud. You’ll also learn best practices for reducing data exposure risks, managing permissions, and staying compliant with regulatory standards.
So, whether you’re working in a regulated industry or simply want to improve your data visibility, this challenge is for you. Let’s take a deep dive into the world of Amazon Macie and learn how to uncover sensitive data hiding in plain sight. Get ready to enhance your AWS security skills through this guided, step-by-step challenge that simulates real-world cloud risk management scenarios. It’s time to shine a light on your data and ensure your S3 buckets are as secure as they should be.

Prerequisites
Before you begin:
- You must have an AWS account.
- The S3 bucket you want to scan must exist and contain data.
- You must have necessary IAM permissions (
AmazonMacieFullAccess,AmazonS3ReadOnlyAccess, etc.)
Step-by-Step Process
Step 1: Enable Amazon Macie
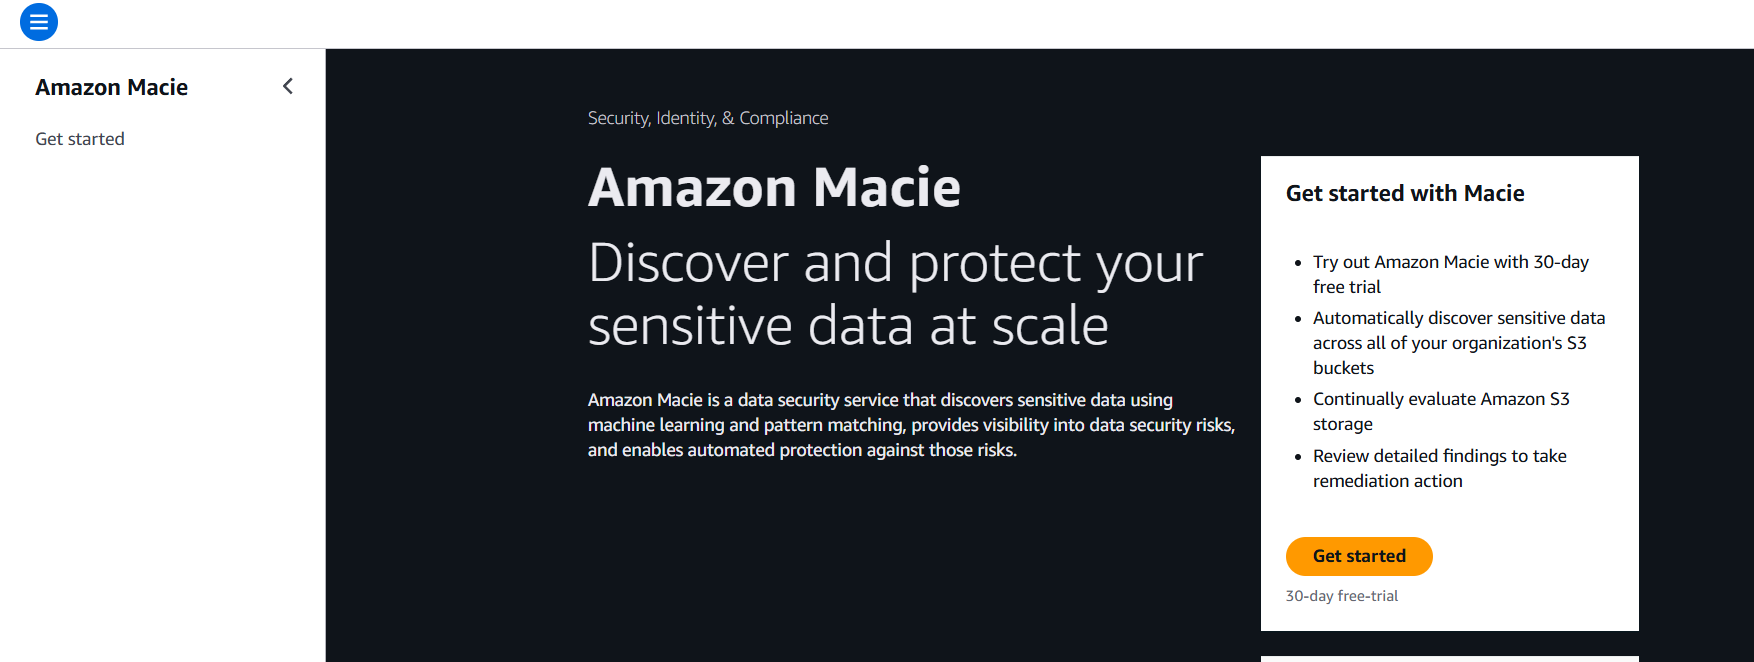
- Go to the AWS Management Console.
- Navigate to Amazon Macie.
- If not already enabled:
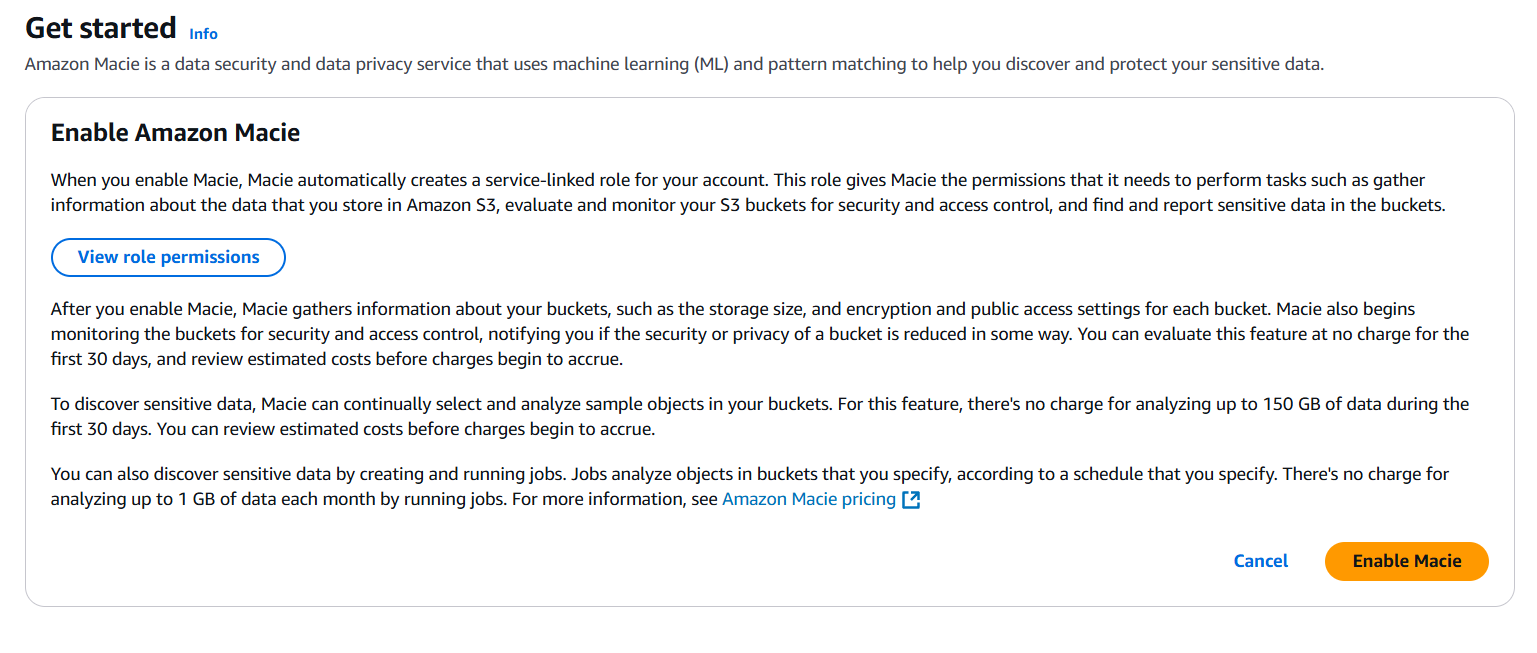
- Click Enable Macie.
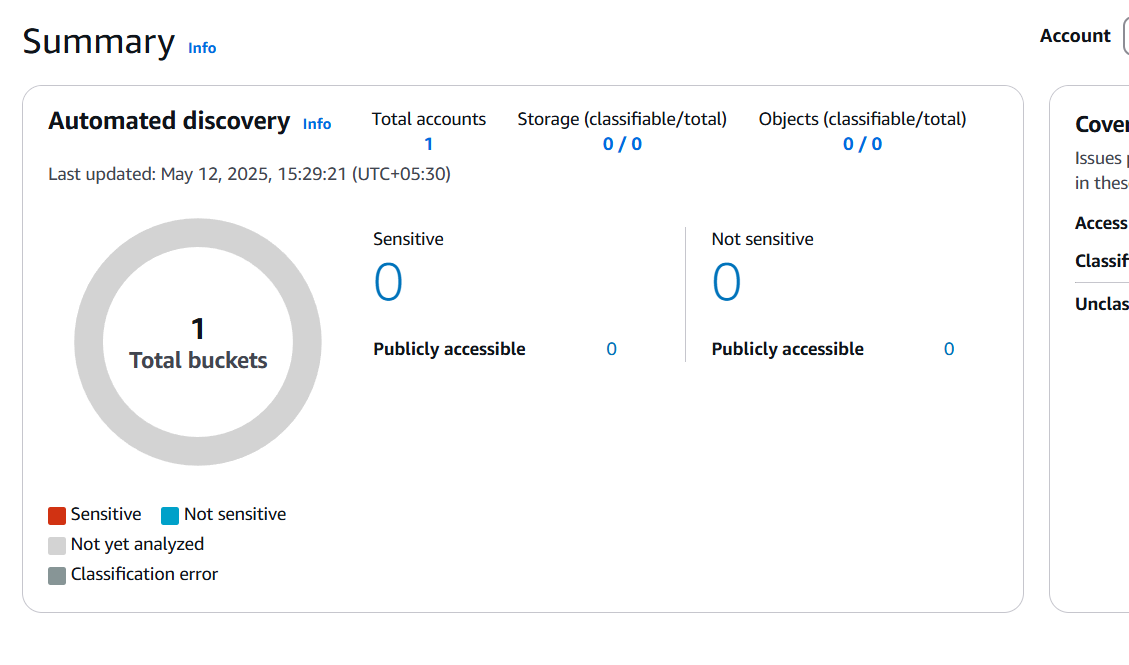
- Macie will start discovering your S3 buckets and their metadata.
Step 2: Review S3 Buckets
- After enabling Macie, go to the S3 Buckets section in the Macie dashboard.
- Macie automatically lists your buckets along with:
- Region
- Number of objects
- Total size
- Public accessibility
- Encryption status

Step 3: Create a Classification Job
- Navigate to the Jobs section.
- Click Create Job.
- Name your job and add a description (optional).
- Select the S3 buckets you want to scan.
Step 4: Configure Scope
- Choose whether to scan:
- All objects
- Objects modified in the last X days
- Specific folders (prefixes)
- You can use object criteria filters if needed (e.g., file type, size).
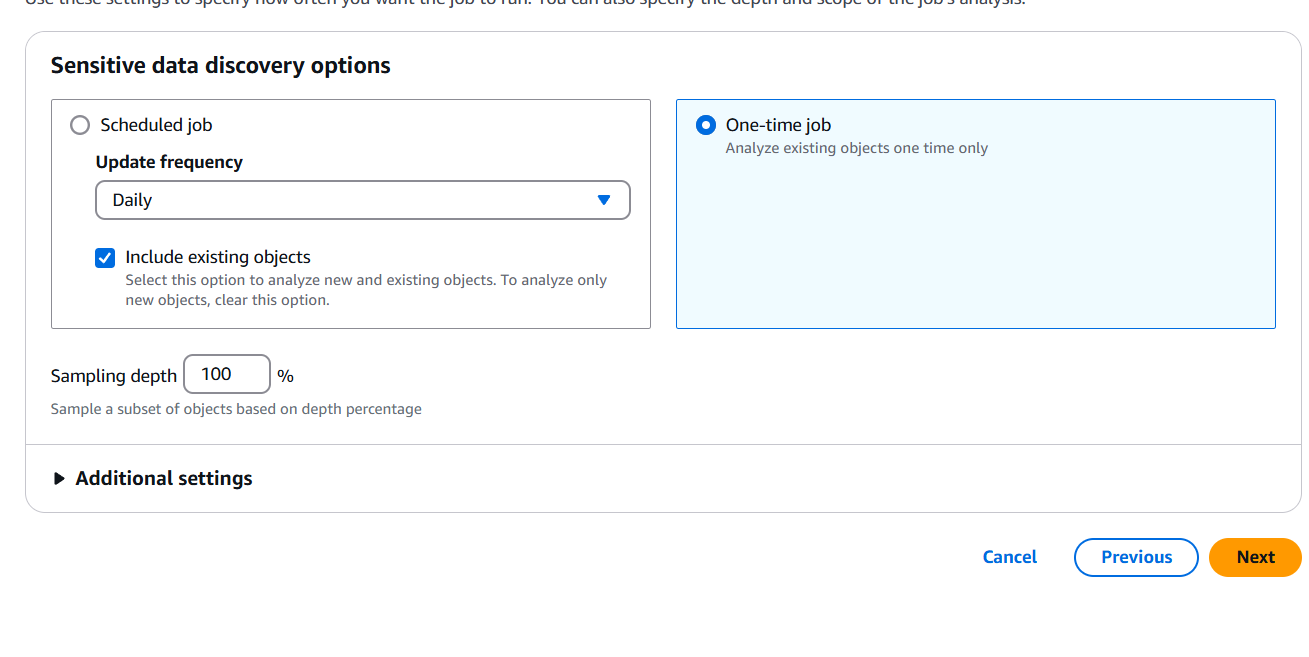
Step 5: Set the Schedule
- Choose one of the following:
- One-time job
- Recurring job (daily, weekly, monthly)
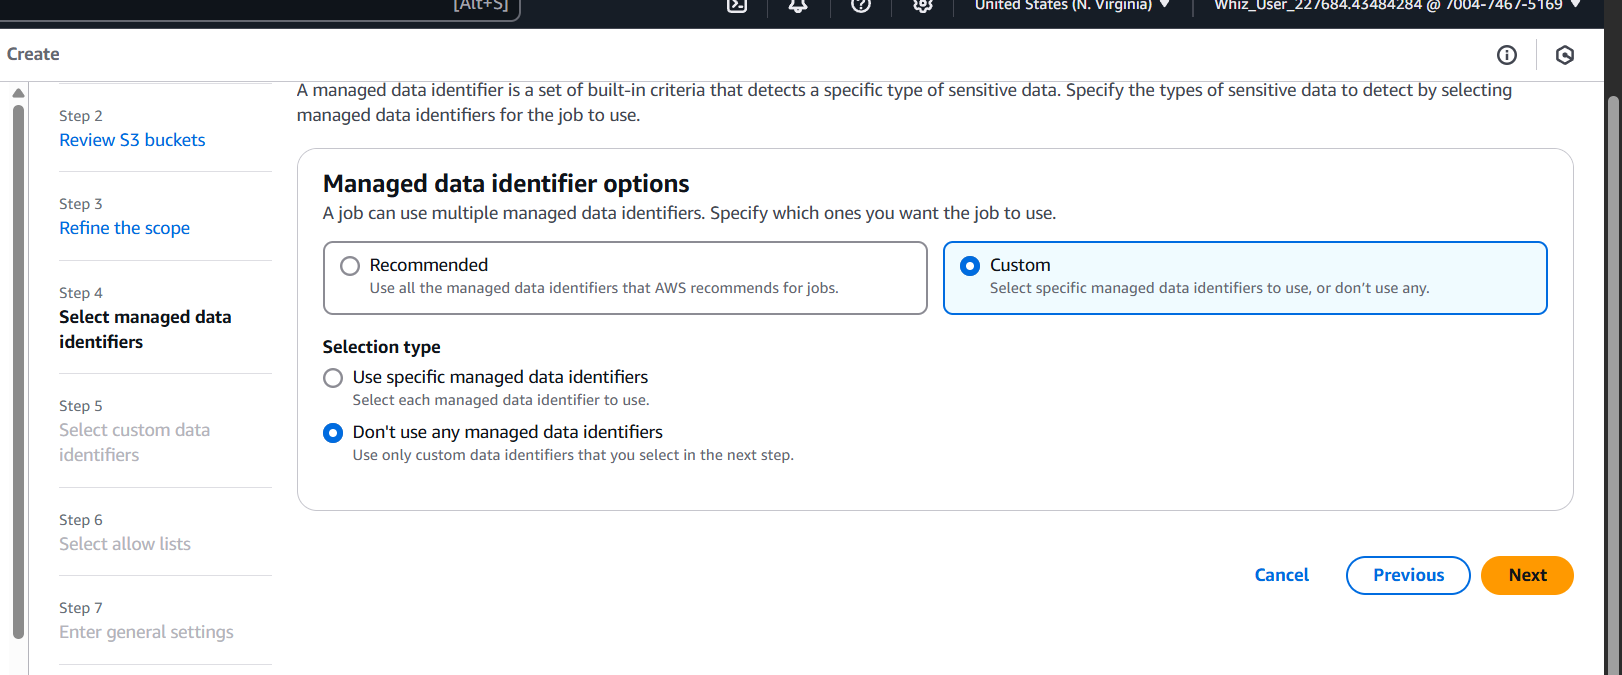
Step 6: Choose Custom Data Identifiers (Optional)
- Macie uses managed data identifiers (e.g., PII, financial data).
- You can add custom identifiers using regex if you need to detect unique patterns (like internal employee IDs).
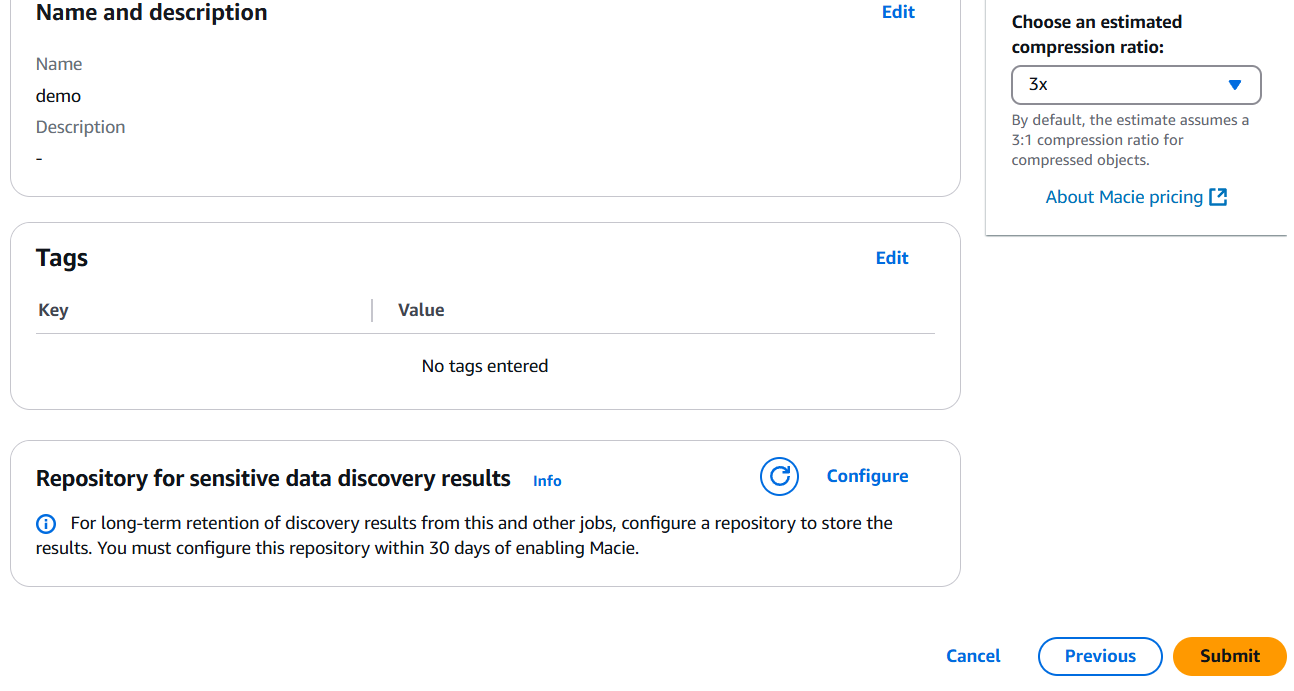
Step 7: Review and Create
- Review your configuration.
- Click Create Job.
- Macie will start analyzing data based on your configuration.



Step 8: View Results
- Go to the Jobs dashboard.
- Click on your job name.
- View results:
- Number of sensitive items found
- Categories (e.g., email addresses, credit card numbers)
- Risk level
- Object path (S3 key)
Step 9: Take Action
- Based on findings, consider:
- Applying encryption
- Adjusting bucket permissions
- Removing sensitive data
- Creating alerts via Amazon EventBridge or AWS Security Hub

Conclusion.
In conclusion, discovering and protecting sensitive data within your Amazon S3 buckets is no longer a daunting task, thanks to the capabilities of Amazon Macie. As cloud adoption continues to rise, so do the challenges of data visibility and compliance. This hands-on challenge has shown how Amazon Macie empowers you to automate the discovery of sensitive information, classify it effectively, and take swift action to secure it. From enabling the service to configuring classification jobs and analyzing results, each step in this workflow adds a critical layer of awareness and control over your cloud data assets. By using Macie proactively, organizations can reduce their risk of data exposure, meet regulatory requirements, and foster a culture of security-first cloud practices. Whether you’re securing a single S3 bucket or an enterprise-scale environment, Amazon Macie offers the intelligence and automation needed to protect what matters most. Make it a regular part of your cloud security toolkit—and stay one step ahead of potential threats.
AWS VPC Architecture for Beginners: A Cafe Deployment Scenario.
Introduction.
In today’s digital age, even your neighborhood cafe needs more than just great coffee—it needs a reliable, secure, and scalable network infrastructure to support online orders, mobile payments, customer loyalty programs, and real-time inventory management. Small businesses like cafes are increasingly moving to the cloud to stay competitive, but cloud networking isn’t always as easy as brewing a fresh cup of espresso. That’s where this challenge begins: creating a Virtual Private Cloud (VPC) environment tailored specifically for a cafe. Whether you’re a beginner in cloud architecture or a professional seeking a practical use case, this challenge offers hands-on experience with designing and deploying a secure VPC on AWS. It’s more than just a theoretical exercise—it’s a real-world scenario that reflects the needs of modern small businesses.
Imagine a cafe that wants to launch a simple web app for customers to browse menus, place orders, and leave feedback. Behind the scenes, the app will need a web server exposed to the internet and a private database server protected from public access. How do you design a network to support this, keeping performance high and security tight? Enter the world of VPCs: a logically isolated section of the AWS cloud where you can launch and manage your resources. With subnets, route tables, security groups, and gateways at your disposal, the goal is to build a custom, secure, and cost-efficient networking environment.
This challenge guides you through each step—starting from creating the VPC itself, configuring public and private subnets, assigning routing rules, setting up internet and NAT gateways, and deploying EC2 instances to host the app and database. You’ll also learn how to apply security group rules to allow only necessary traffic, ensuring that the database remains shielded from the public while the web server stays accessible. Along the way, you’ll gain a deeper understanding of cloud network design principles and best practices.
The cafe scenario provides an approachable yet realistic challenge. It’s not just about clicking buttons in the AWS console—it’s about thinking like a cloud architect. How would you ensure high availability? What if the cafe expands and needs more servers? What if you need logging, monitoring, or VPN access later on? These considerations help build your skills beyond just basic setup and push you to design scalable infrastructure. Whether you’re prepping for an AWS certification, working on a personal project, or teaching cloud networking fundamentals, this challenge delivers value through practical experience.

By the end of this guide, you’ll have built a fully functional, production-grade VPC environment tailored for a small business. You’ll know how each component fits together, why it matters, and how to troubleshoot issues when they arise. Ready to get started? Let’s dive in and build a cloud network that’s as strong as your favorite dark roast—welcome to the VPC networking challenge for the cafe.
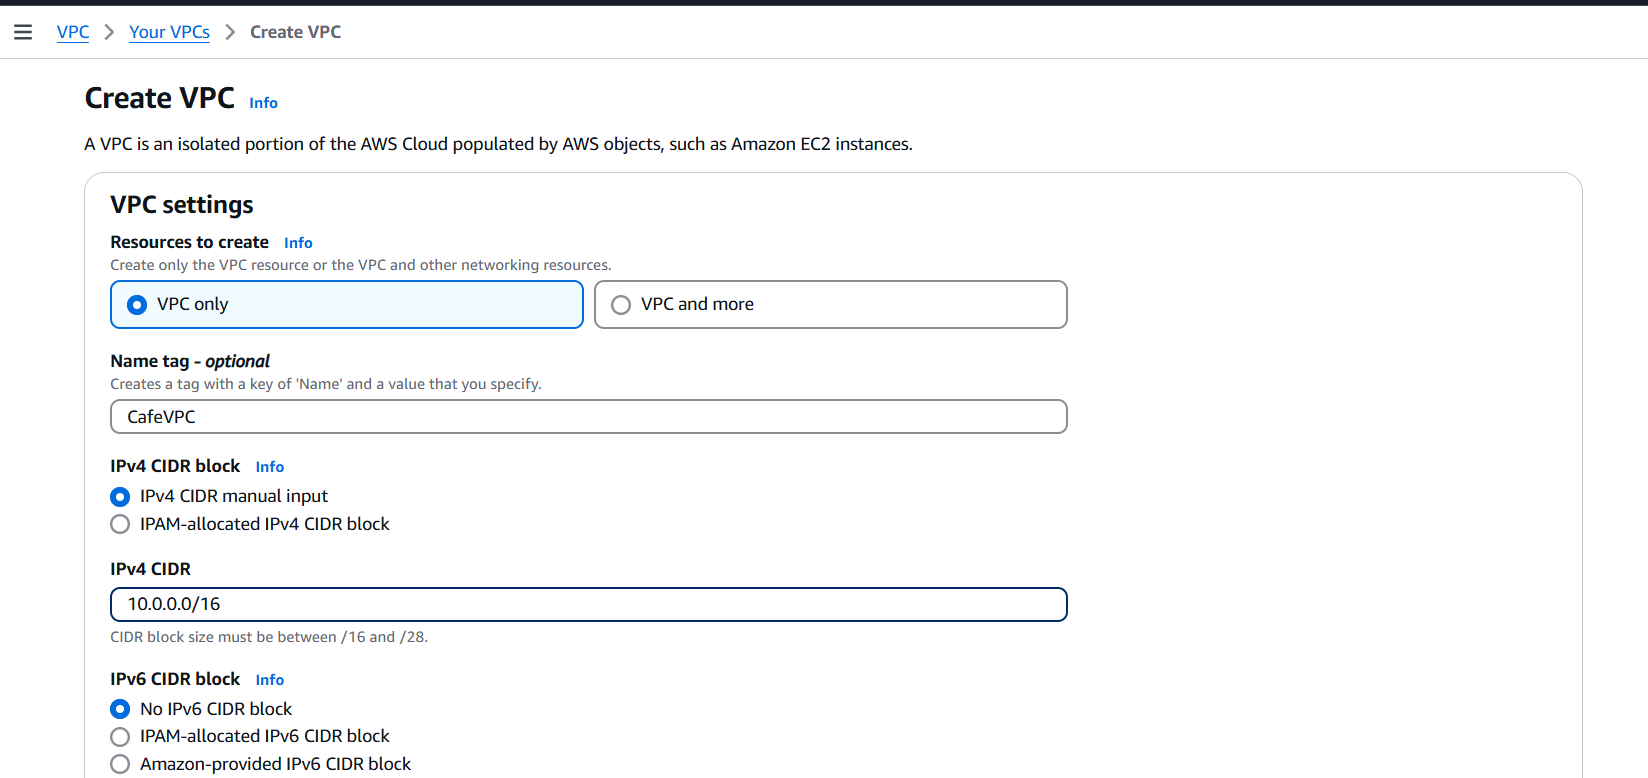
Step 1: Create the VPC
- Go to the AWS VPC dashboard.
- Click Create VPC > Choose VPC with public and private subnets (VPC Wizard) or custom VPC.
- Enter:
- Name:
CafeVPC - IPv4 CIDR block:
10.0.0.0/16 - Enable DNS hostnames: ✅
- Click Create VPC
- Name:

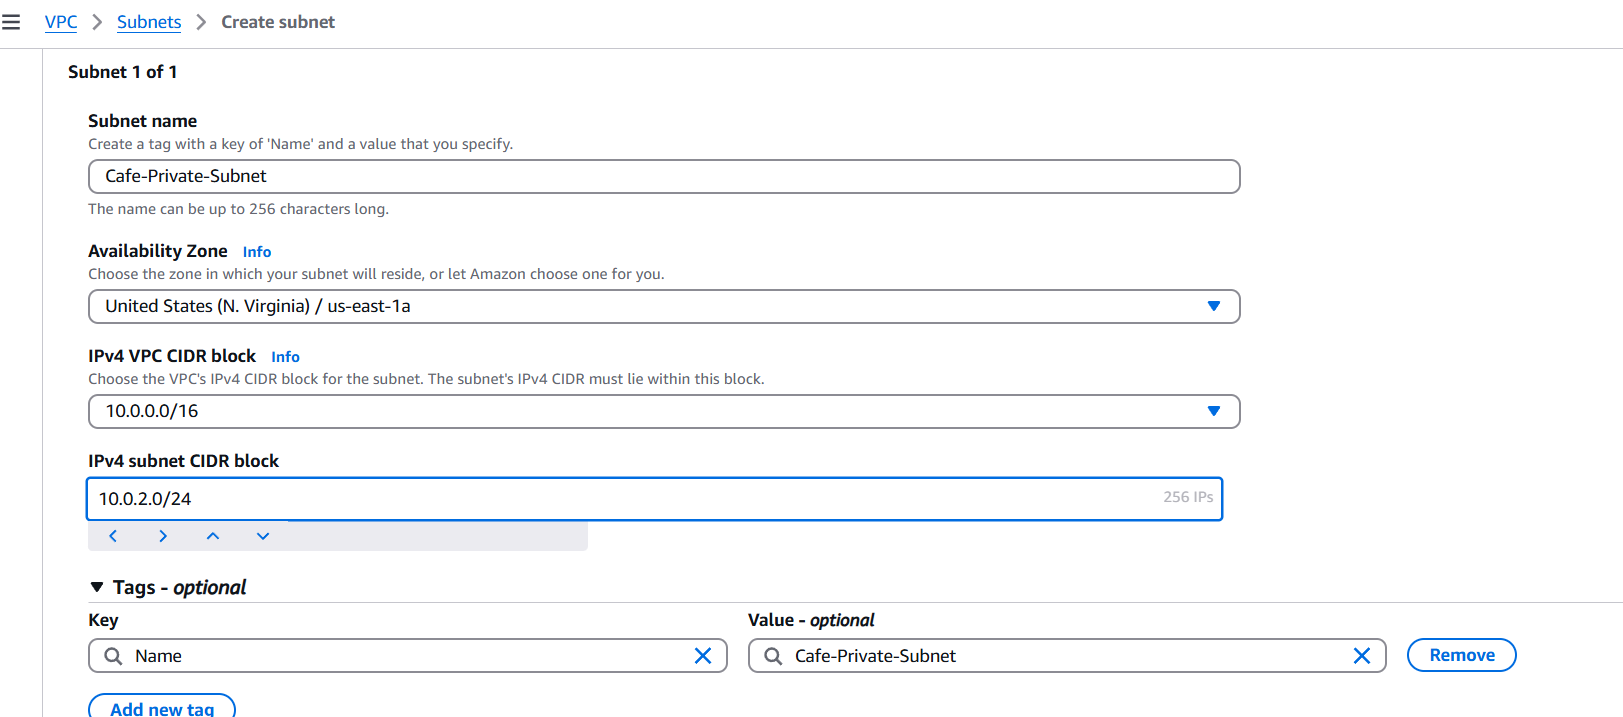
Step 2: Create Subnets
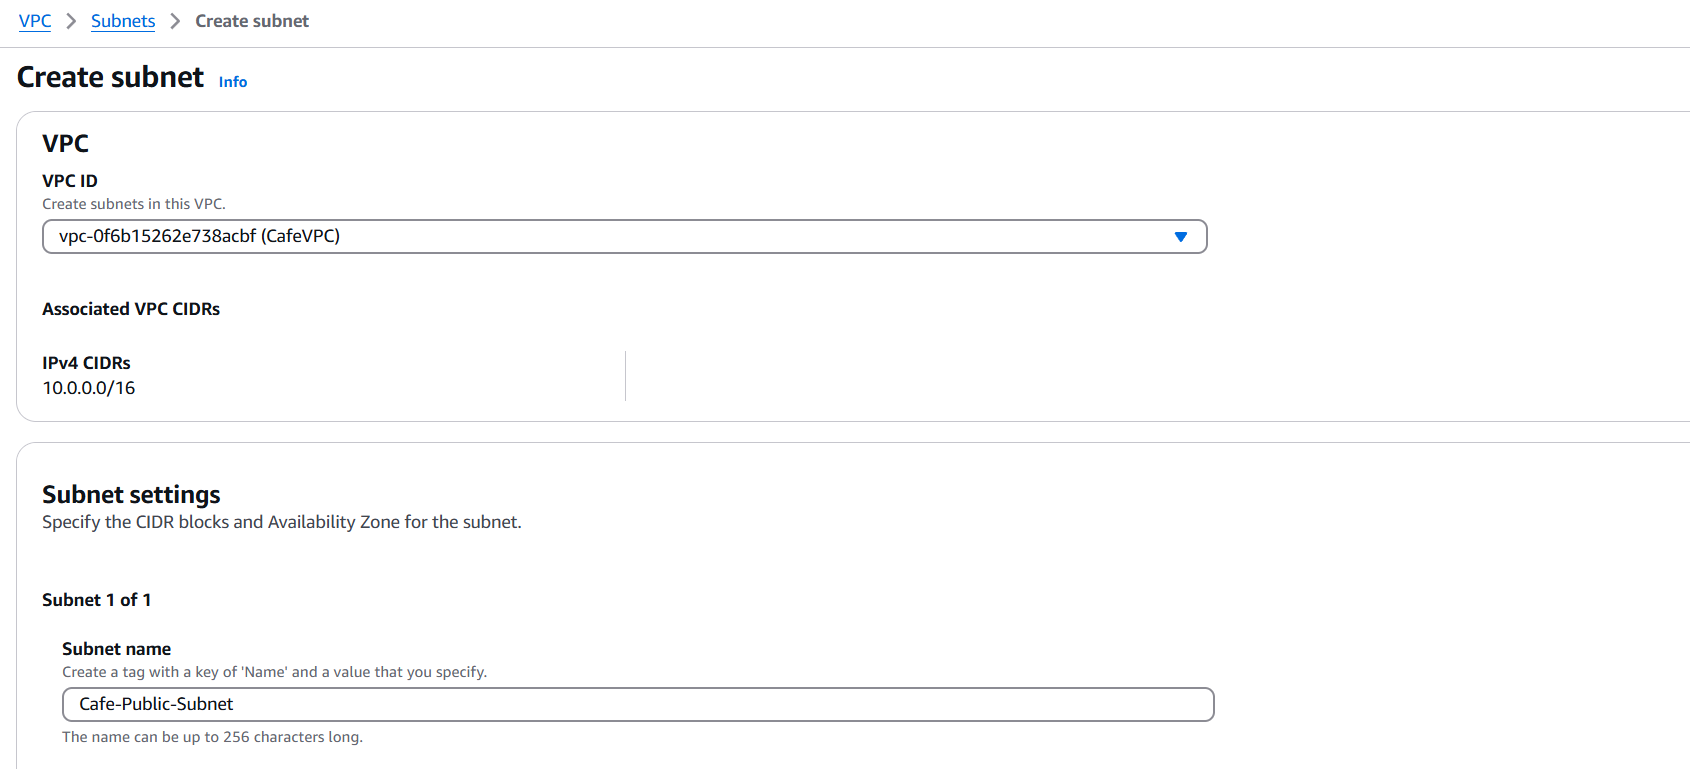
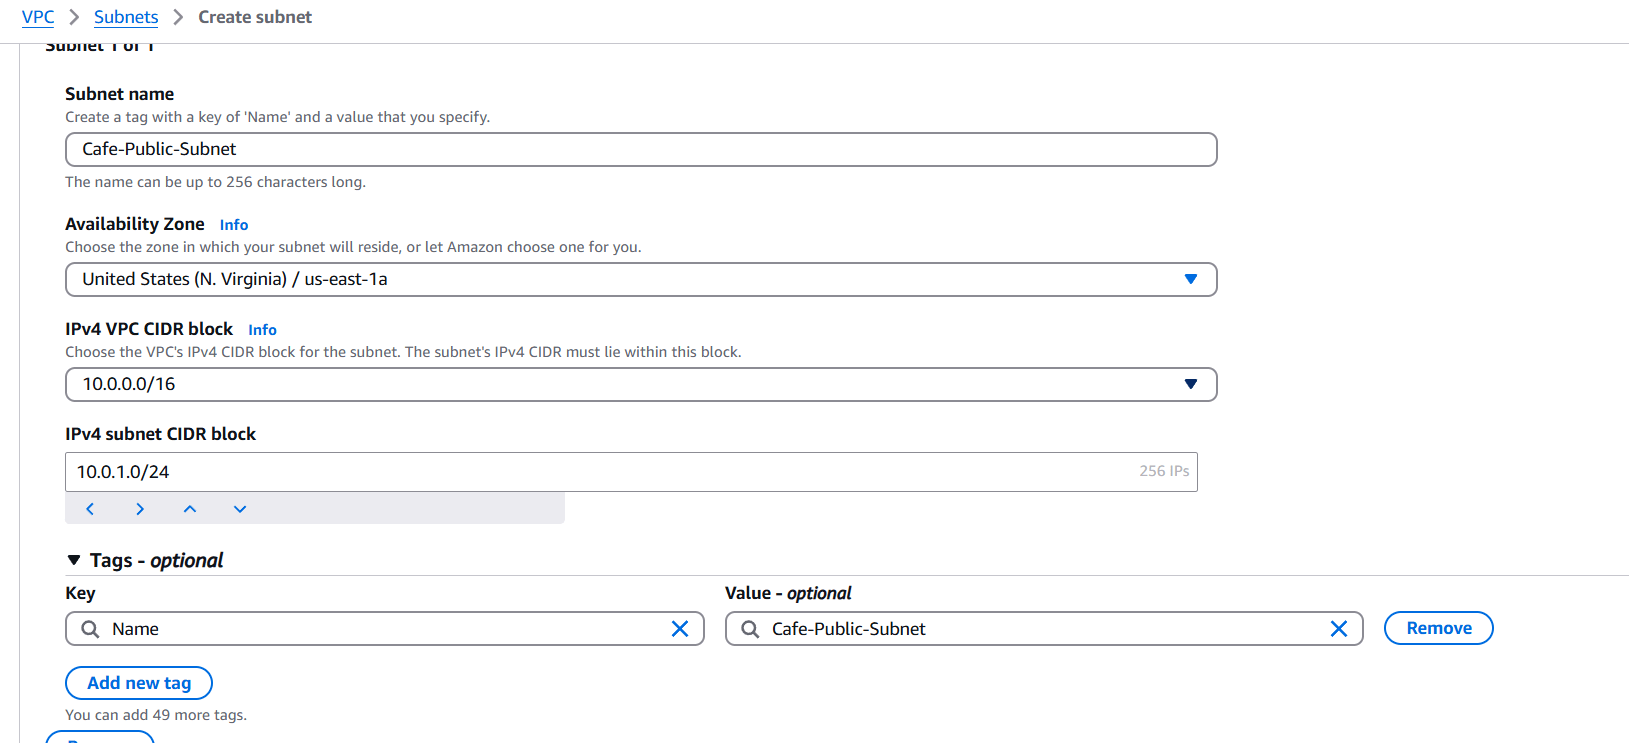
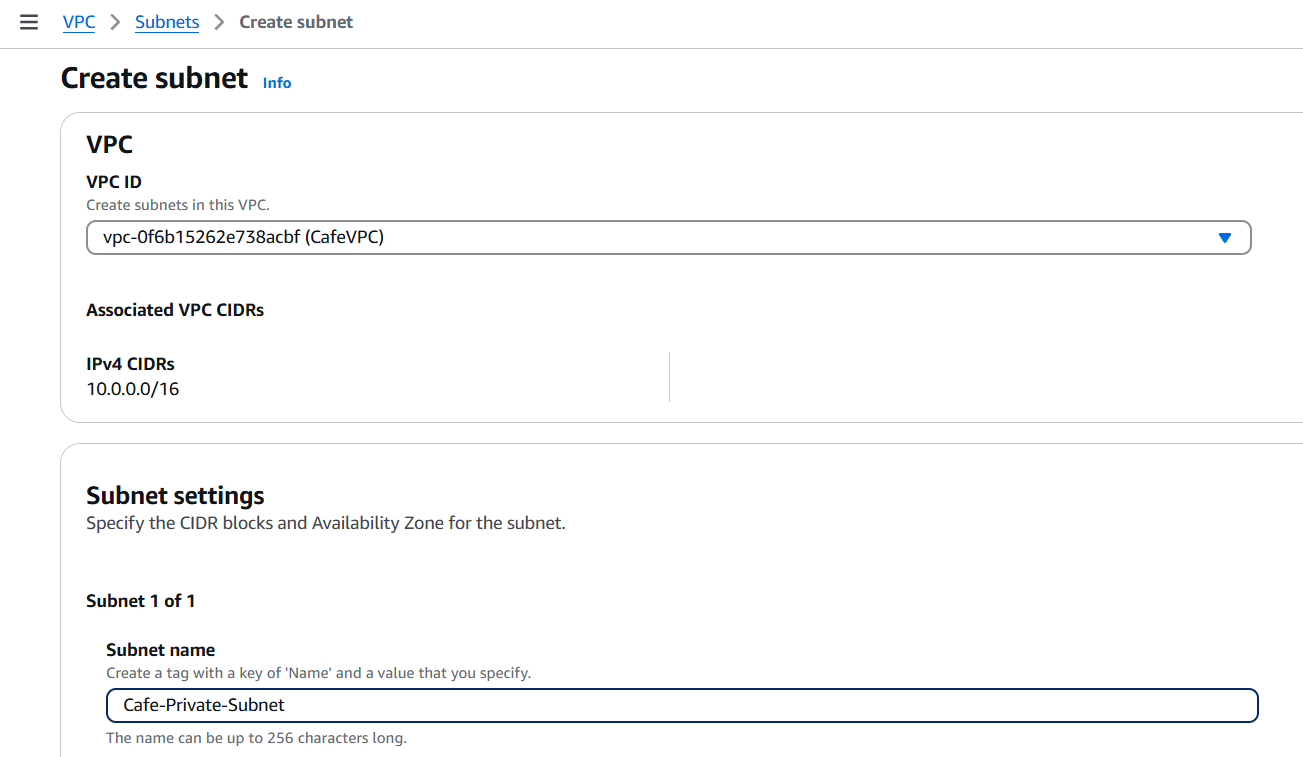
Create two subnets:
- Public Subnet:
- Name:
Cafe-Public-Subnet - CIDR block:
10.0.1.0/24 - Availability Zone: e.g.,
us-east-1a
- Name:
- Private Subnet:
- Name:
Cafe-Private-Subnet - CIDR block:
10.0.2.0/24 - Availability Zone:
us-east-1a
- Name:

Step 3: Create an Internet Gateway
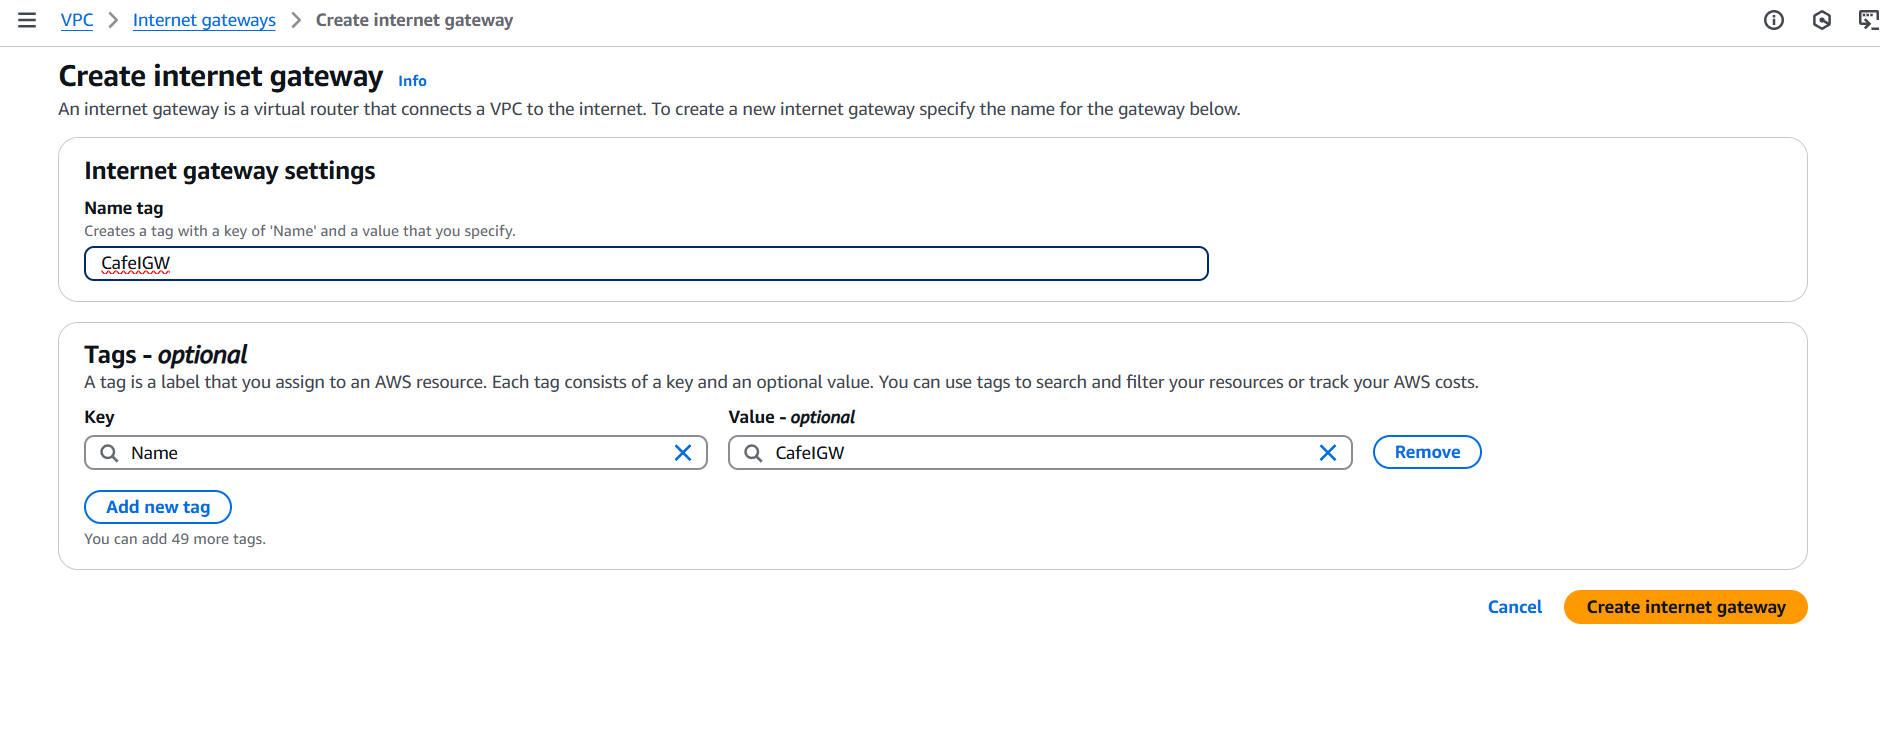
- Go to VPC > Internet Gateways > Create Internet Gateway
- Name:
CafeIGW - Attach it to your
CafeVPC


Step 4: Configure Route Tables
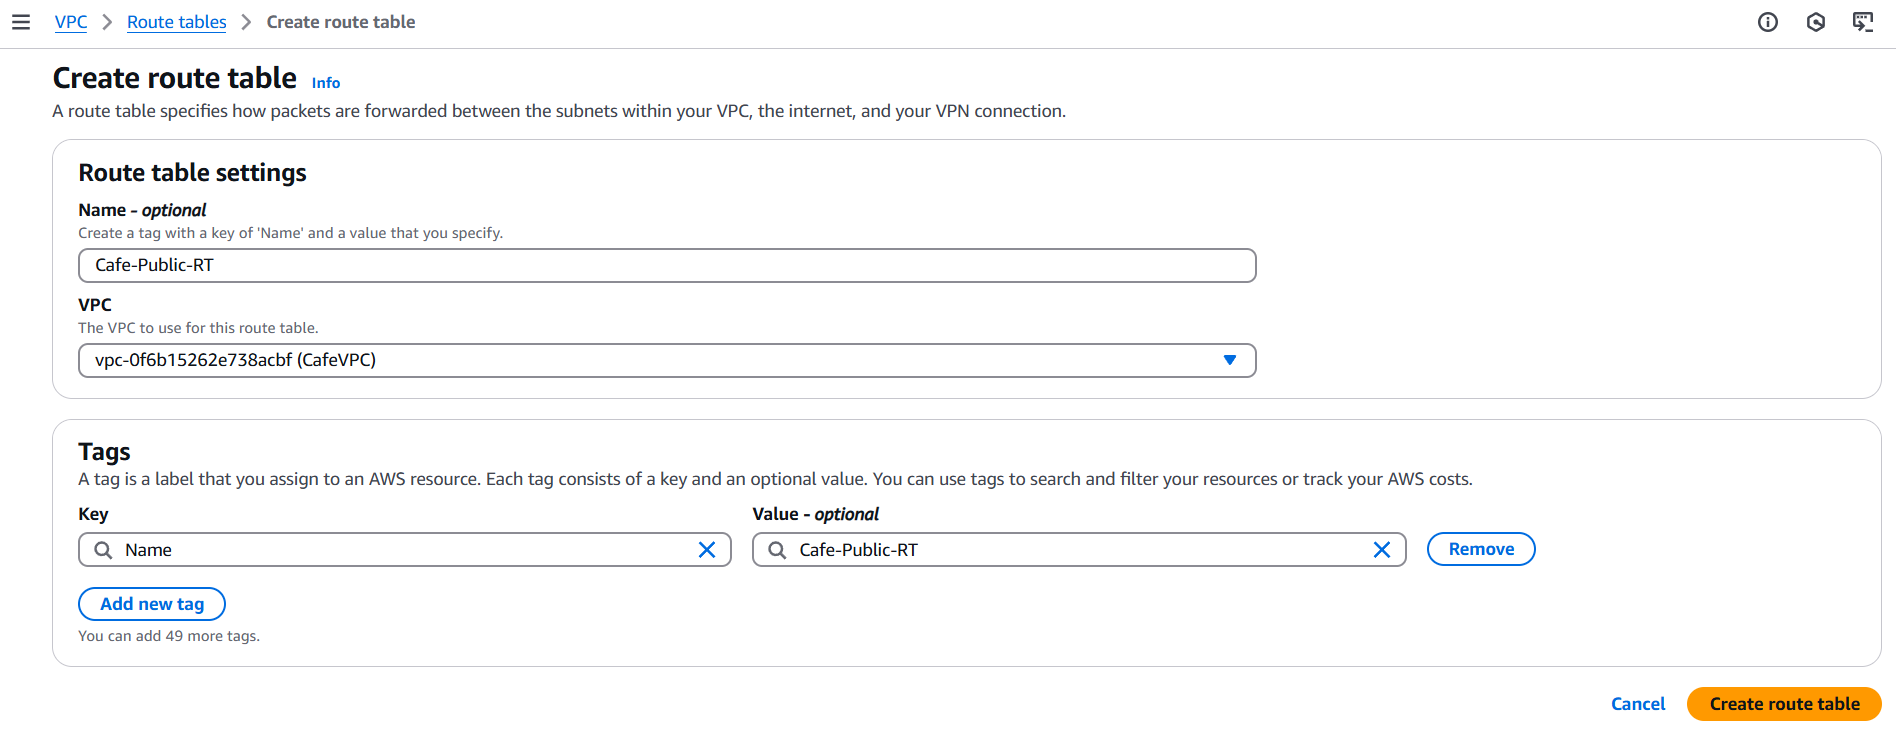
- Public Route Table:
- Create a route table named
Cafe-Public-RT - Add route:
0.0.0.0/0→ Target: Internet GatewayCafeIGW - Associate this route table with the Public Subnet
- Create a route table named
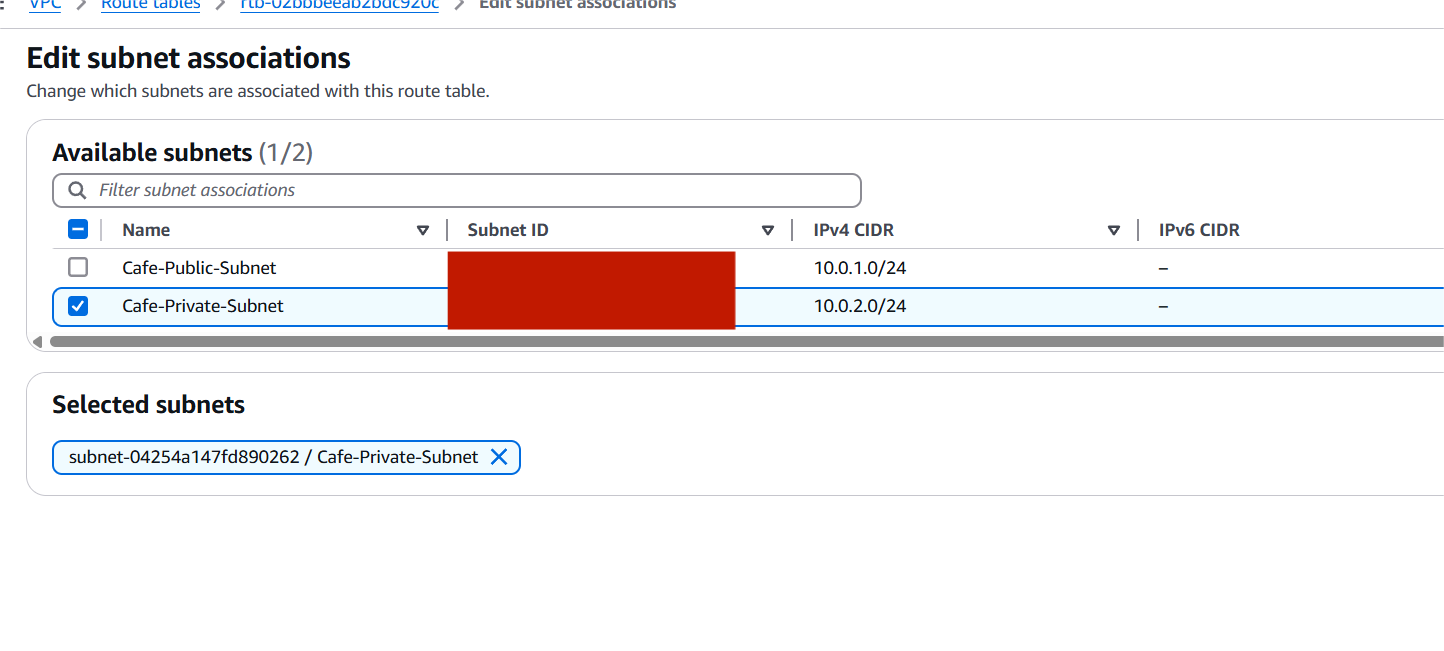
- Private Route Table:
- Create a route table named
Cafe-Private-RT - Initially, no route to the internet (optional: NAT in future)
- Associate this with the Private Subnet
- Create a route table named



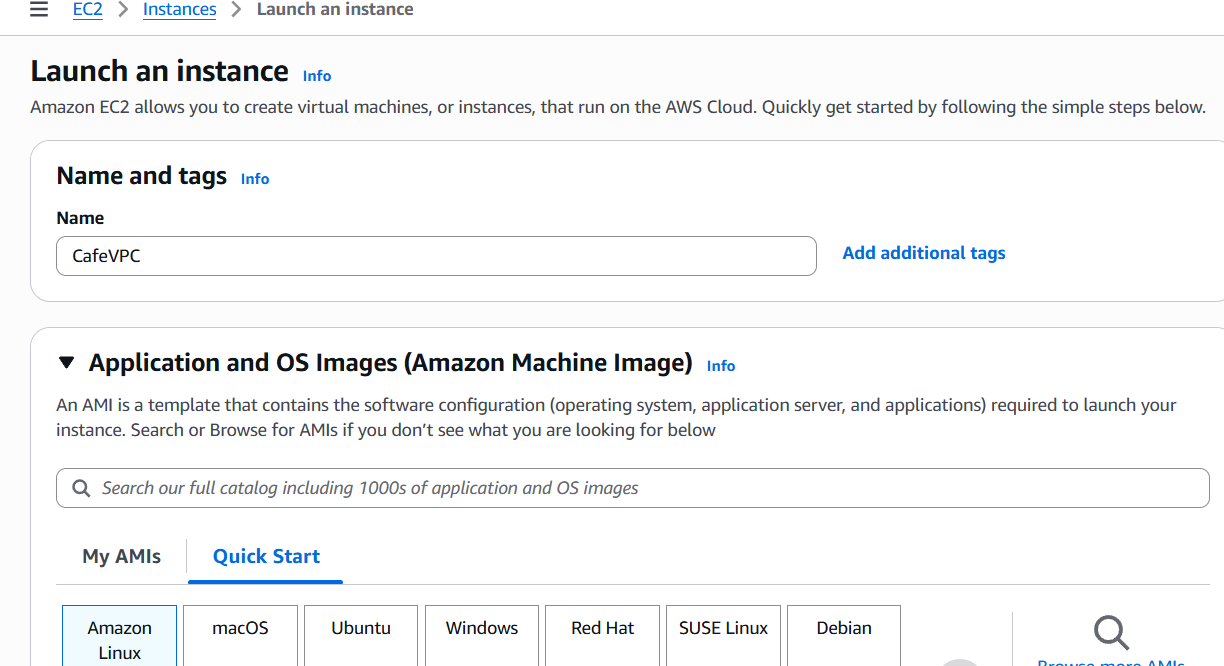
Step 5: Launch EC2 Instances
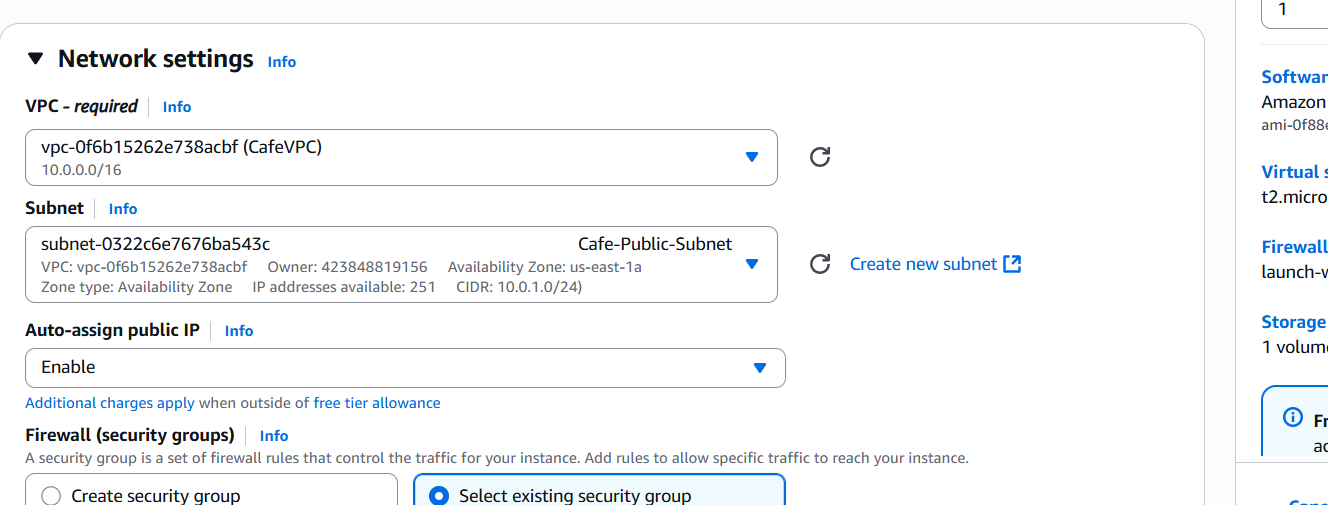
- Public Instance (Web Server):
- Network:
CafeVPC - Subnet:
Cafe-Public-Subnet - Security Group: allow HTTP (80), HTTPS (443), and SSH (22)
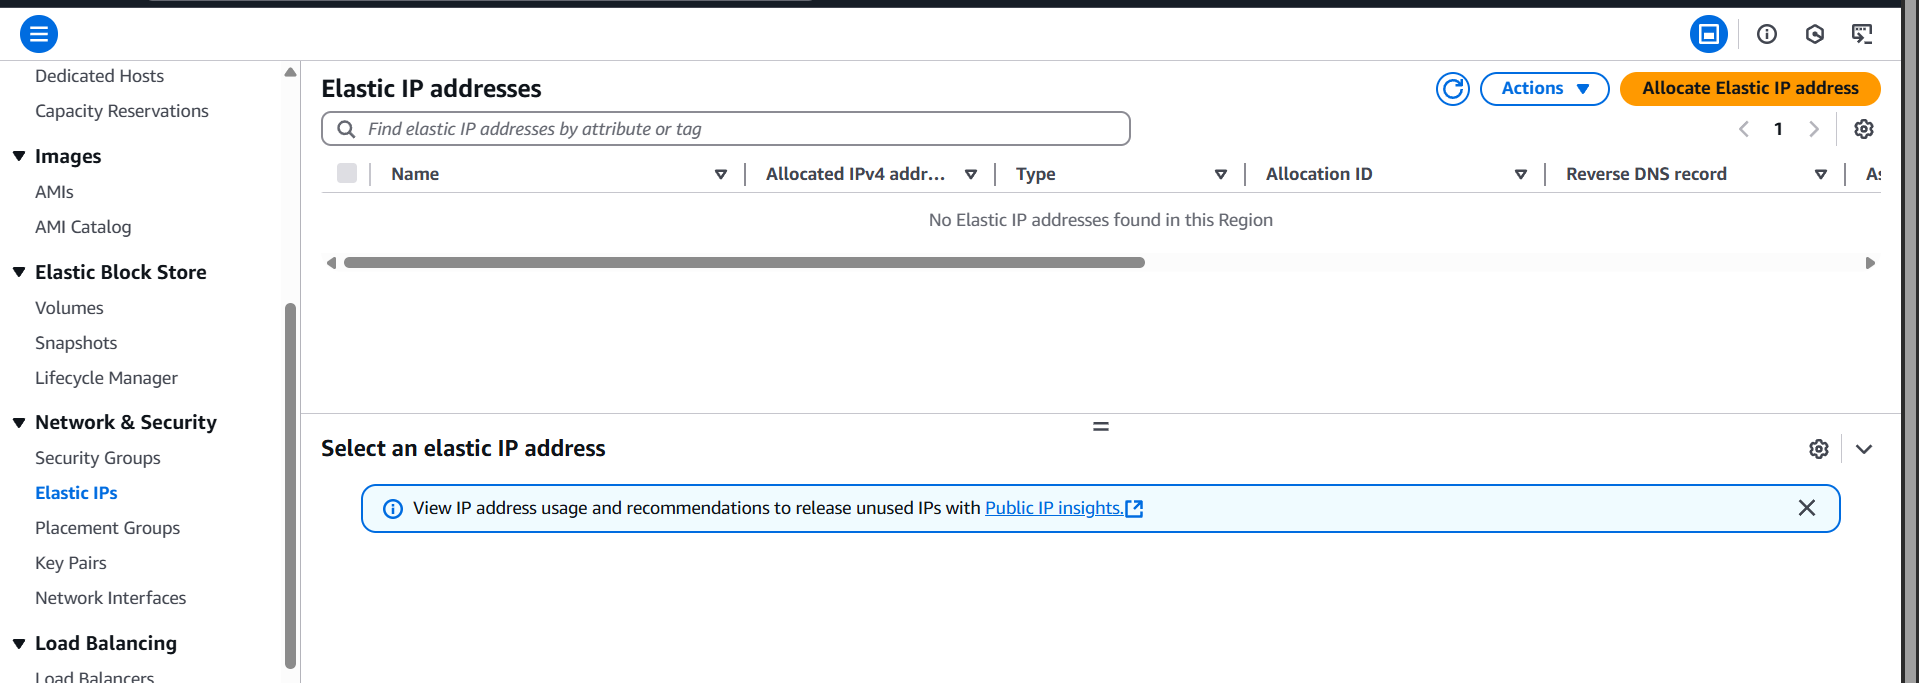
- Elastic IP: Allocate and associate to instance
- Network:
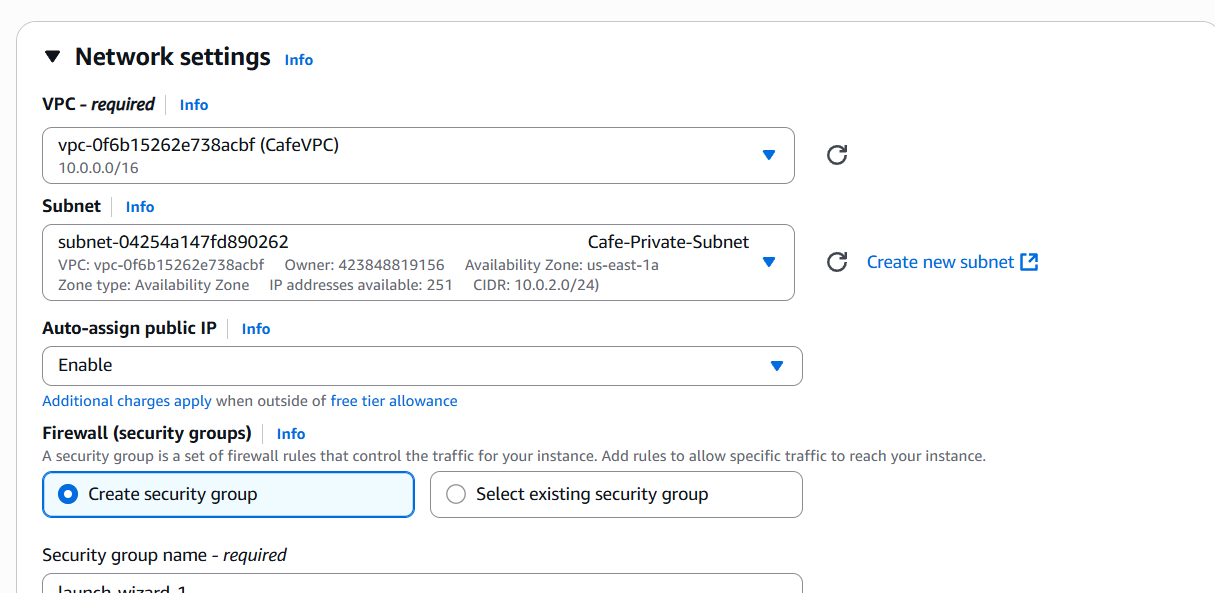
- Private Instance (Database Server):
- Network:
CafeVPC - Subnet:
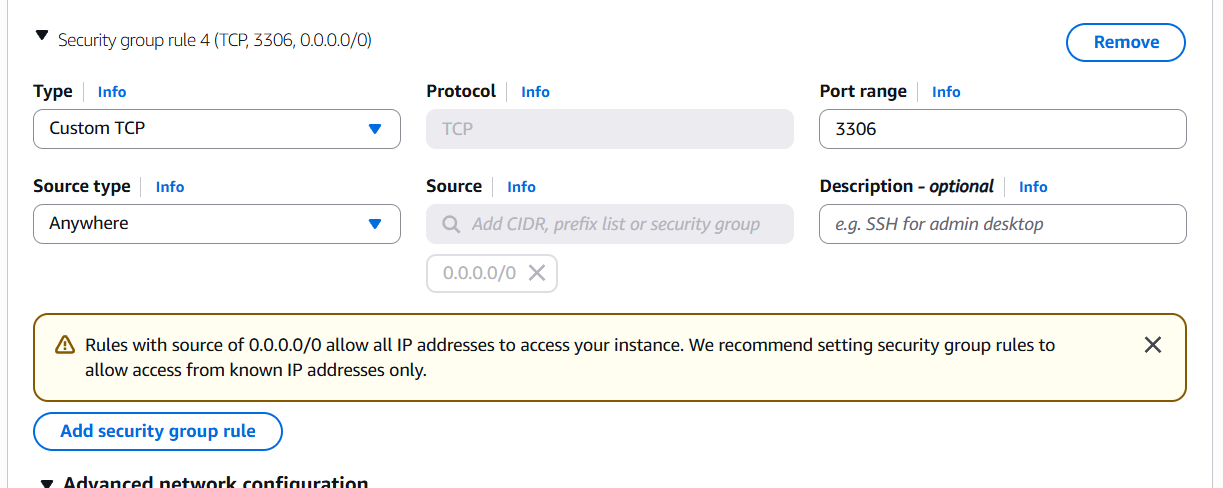
Cafe-Private-Subnet - Security Group: allow MySQL (3306) from the Public Instance’s IP only
- Network:
Step 6: Security Groups
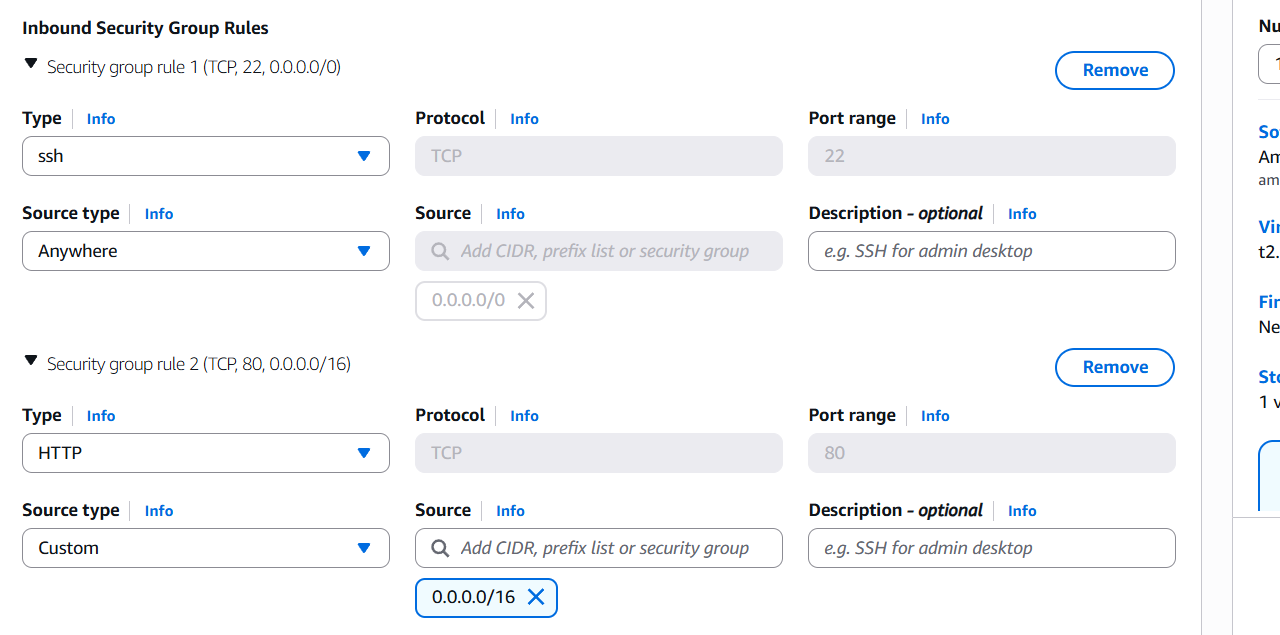
- Web SG:
- Inbound: allow HTTP (80), HTTPS (443), SSH (22) from
0.0.0.0/0 - Outbound: allow all (default)
- Inbound: allow HTTP (80), HTTPS (443), SSH (22) from
- DB SG:
- Inbound: allow port 3306 only from Web SG
- Outbound: allow all (default)
Step 7: Test Connectivity
- Connect via SSH to the web server using the Elastic IP.
- Ensure you can:
- Access the web server from your browser.
- The web server can reach the database (test via internal IP).
Optional: Add NAT Gateway (If Private Instance Needs Internet)
- Create NAT Gateway in Public Subnet.
- Add route
0.0.0.0/0in Private Route Table via NAT Gateway.

Conclusion.
Creating a VPC networking environment for a cafe may seem like a small task, but it reflects the foundational skills needed to build secure, scalable cloud infrastructure for any modern business. Through this challenge, we’ve explored how to design a basic yet production-ready network architecture using AWS VPC, including public and private subnets, routing, internet access, and security best practices. From launching EC2 instances to configuring gateways and security groups, every step reinforced real-world cloud principles that apply far beyond just a cafe setup. More importantly, you’ve learned to think critically about network design, balancing accessibility with security and simplicity with scalability. Whether you’re just starting out or sharpening your skills for certification or client work, mastering these fundamentals prepares you for far more complex deployments in the future. So the next time you sip your coffee, remember—cloud architecture, like a good brew, is all about thoughtful preparation, careful execution, and consistent improvement. Keep experimenting, keep learning, and keep building. Your next challenge awaits.
Live Tail on AWS CloudWatch Logs Made Easy – Beginner’s Guide.
Introduction.
In today’s fast-paced, cloud-native development world, real-time visibility into application logs is no longer a luxury—it’s a necessity. Whether you’re troubleshooting a production issue, validating a recent deployment, or monitoring a service under load, having immediate access to logs as they are generated can be the difference between minutes and hours of downtime. That’s where the Live Tail feature in Amazon CloudWatch Logs comes into play. Designed to provide a near-instant stream of log data, Live Tail empowers developers, DevOps engineers, and SREs with the tools they need to watch logs in real time—much like the classic Unix tail -f command, but fully integrated into AWS’s cloud ecosystem.
Amazon CloudWatch Logs has long been a central part of AWS’s observability suite, allowing users to store, monitor, and analyze log data from a wide variety of AWS services and custom applications. However, until recently, real-time log monitoring required third-party tools or complex workarounds. With the introduction of Live Tail, AWS now offers a native, easy-to-use solution for streaming logs directly within the CloudWatch console, without requiring any additional setup. This feature helps teams spot issues as they happen, without delay, and take immediate action—whether that means rolling back a deployment, restarting a service, or digging deeper into a stack trace.
What makes Live Tail particularly useful is its seamless integration with other AWS features, such as CloudWatch Alarms, Metrics, and Logs Insights. When used in combination, Live Tail not only helps you see what’s happening now but also gives you the historical context needed to understand why it’s happening. Live Tail supports filtering, so you can narrow down the data stream to just the log events that matter—be it a specific log level, service, or keyword. This is particularly helpful in environments where thousands of logs are generated every second and sifting through them manually would be impossible.
In this guide, we’ll take you step-by-step through using the Live Tail feature in CloudWatch Logs. You’ll learn how to access the CloudWatch console, find your log groups, enable Live Tail, and use filters to refine your view. We’ll also explore some practical use cases and tips to make the most of this feature in your day-to-day operations. Whether you’re new to AWS or an experienced cloud engineer, this tutorial will help you leverage Live Tail to enhance your observability practices and gain more control over your cloud workloads.

By the end of this post, you’ll have a clear understanding of how Live Tail works, when to use it, and how it can help you maintain system health, resolve issues faster, and deliver better uptime for your applications. Let’s dive in.
Step 1: Sign in to the AWS Management Console
- Go to https://console.aws.amazon.com/
- Use your credentials to log into the AWS Management Console.
Step 2: Open the CloudWatch Console
- Navigate to CloudWatch:
- You can find it by typing “CloudWatch” in the AWS services search bar.
Step 3: Go to the Logs section
- In the left navigation pane, click on “Logs”.
- Select “Log groups” to view all your available log groups.
Step 4: Choose a Log Group
- Click on the log group you want to monitor.
- You will see a list of log streams in that group.
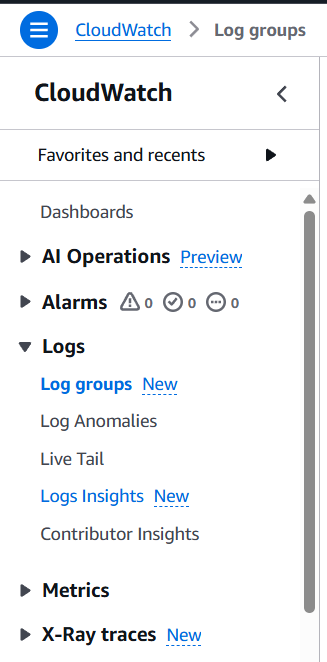

Step 5: Select “Live Tail”
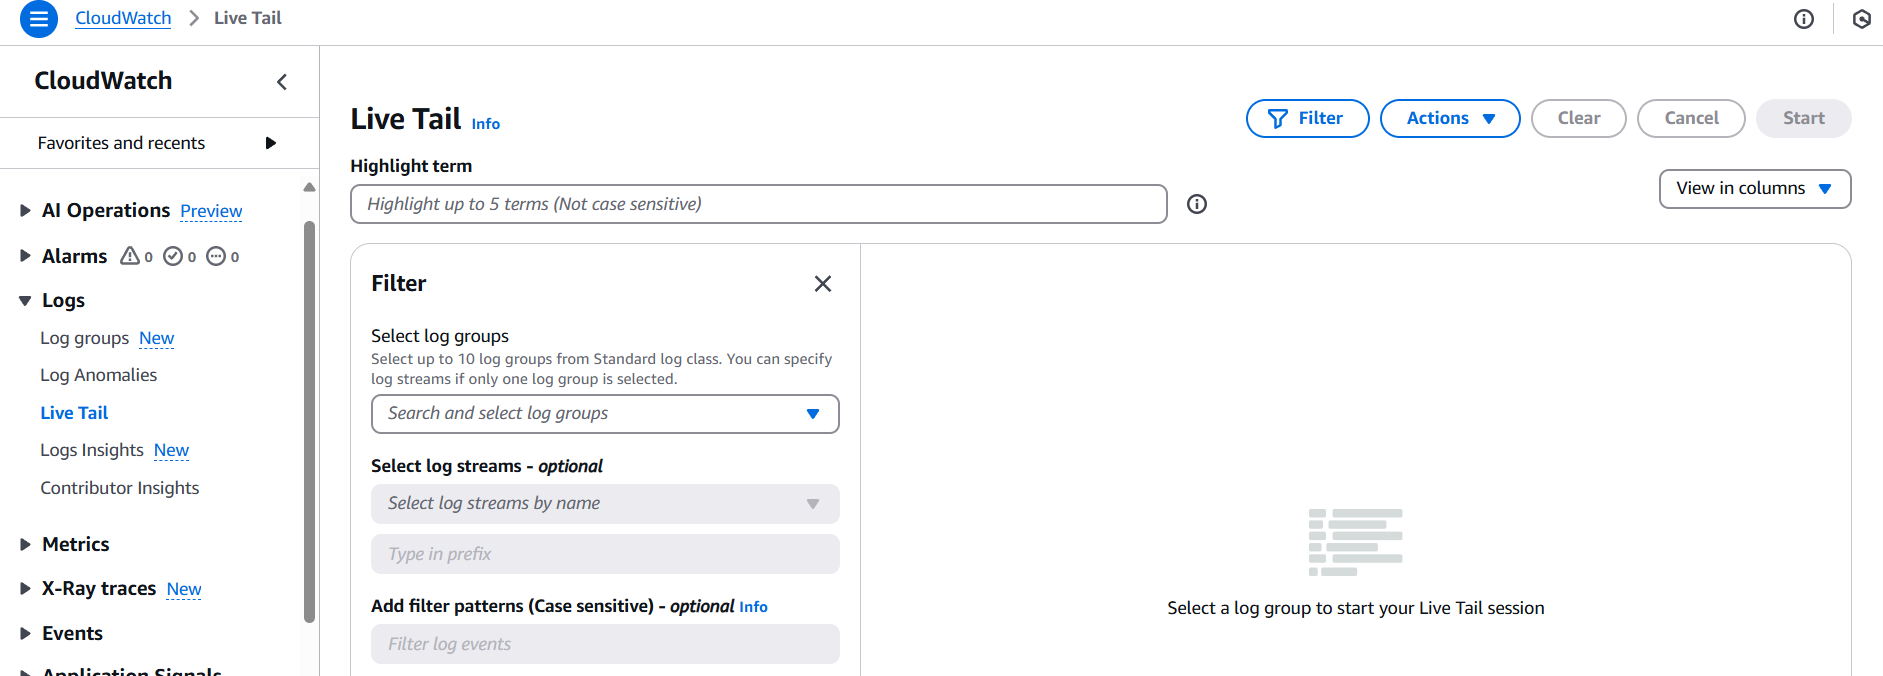
- Click the “Live Tail” button at the top of the log stream list (or inside a specific log stream).
- This opens a real-time view where log events stream in as they occur.
Step 6: (Optional) Add Filters
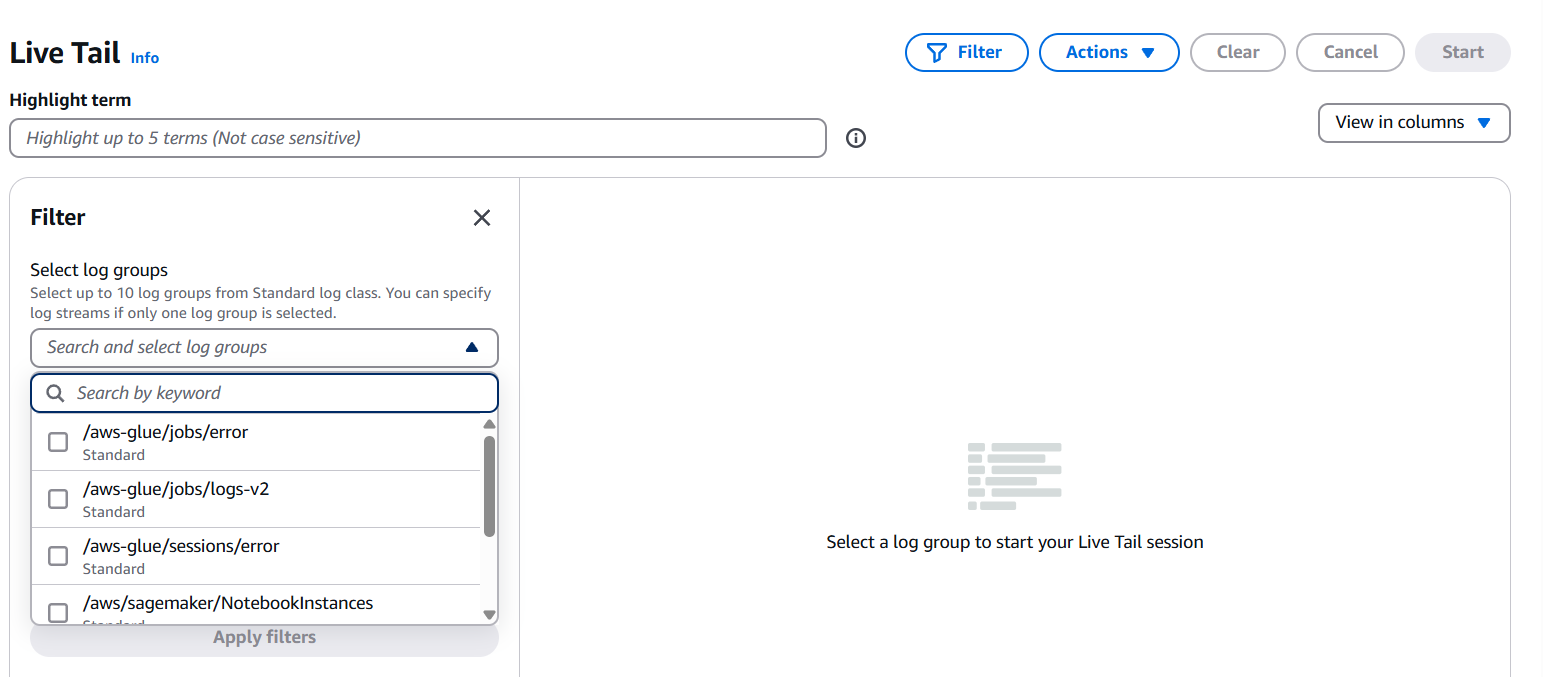
- You can filter logs using search terms or CloudWatch Logs Insights syntax.
- This helps to focus on specific messages or patterns.
Step 7: Monitor Logs in Real Time
- As new log events are generated, they will appear in the Live Tail view.
- You can pause/resume the stream or clear the view as needed.

Conclusion.
In conclusion, the Live Tail feature in Amazon CloudWatch Logs is a powerful addition to AWS’s observability toolkit, enabling real-time log monitoring directly within the console. Whether you’re debugging an application, watching a critical deployment, or keeping an eye on production systems, Live Tail gives you the immediacy and visibility you need to act fast. It removes the need for external log viewers or complex setups and instead delivers a streamlined, cloud-native solution for modern DevOps and cloud engineers. With the ability to apply filters, pause the stream, and integrate with other CloudWatch tools, Live Tail offers both simplicity and flexibility. If you’re working in AWS and haven’t explored this feature yet, now is the perfect time to start. Real-time insights are just a few clicks away—and they can make all the difference when seconds count.
Step-by-Step: Handle AWS IoT Messages Using AWS Lambda.
Introduction.
In today’s rapidly evolving Internet of Things (IoT) landscape, the ability to efficiently process and respond to data generated by connected devices is critical for building smart applications and services. Amazon Web Services (AWS) provides a comprehensive suite of tools that allow developers to build scalable, secure, and responsive IoT solutions. One of the most powerful and widely used combinations in this toolkit is AWS IoT Core integrated with AWS Lambda. Together, they enable serverless, real-time data processing without the need to manage infrastructure manually.
AWS IoT Core is a managed cloud service that lets connected devices easily and securely interact with cloud applications and other devices. It supports millions of devices and billions of messages, and it routes those messages to AWS endpoints and other devices reliably and securely. Lambda, on the other hand, is AWS’s event-driven compute service that lets you run code in response to triggers without provisioning or managing servers. Integrating AWS IoT Core with AWS Lambda allows developers to automatically process incoming messages from IoT devices using serverless functions, which can filter, transform, route, and store data in real-time.
The core idea is simple yet powerful: devices send messages to AWS IoT Core over MQTT, HTTP, or WebSockets. Once received, these messages are evaluated against rules defined in AWS IoT Rules Engine. If a rule condition is met, the message is passed to the target action, such as invoking a Lambda function. This process is entirely managed, scalable, and secure, making it ideal for handling high volumes of device messages with minimal operational overhead.
To implement this setup, a few foundational steps are required. First, you define your IoT devices in AWS, known as “Things,” and securely connect them using X.509 certificates. Next, you create a Lambda function that contains your logic for processing messages — for example, filtering data, storing records in DynamoDB, or sending alerts via SNS. Then, using the AWS IoT Rules Engine, you create a rule that listens to a specific MQTT topic and triggers the Lambda function when a message arrives on that topic. Permissions are handled via AWS Identity and Access Management (IAM), ensuring secure interaction between IoT Core and Lambda.
One major advantage of using Lambda is its scalability and pay-per-use model, which means you only pay for the compute time your function uses, making it highly cost-effective for IoT workloads that can be spiky or unpredictable. Furthermore, since Lambda supports multiple languages like Python, Node.js, Java, and others, developers have the flexibility to write processing logic in the language of their choice.
Monitoring and debugging are streamlined through AWS CloudWatch, where logs and metrics provide visibility into both the IoT messages and Lambda executions. This integration enables rapid development cycles and fast troubleshooting. Moreover, Lambda functions can be connected downstream to a variety of AWS services like S3, DynamoDB, SNS, SQS, and more, enabling powerful IoT workflows without managing any servers.

In summary, using AWS Lambda to handle AWS IoT messages allows developers to build highly responsive, serverless applications that can scale with demand and respond in real time to events from connected devices. This integration is ideal for smart home systems, industrial monitoring, agriculture tech, logistics, and many other IoT domains. It reduces complexity, enhances security, and accelerates development by letting AWS manage the underlying infrastructure, freeing developers to focus on creating innovative solutions.
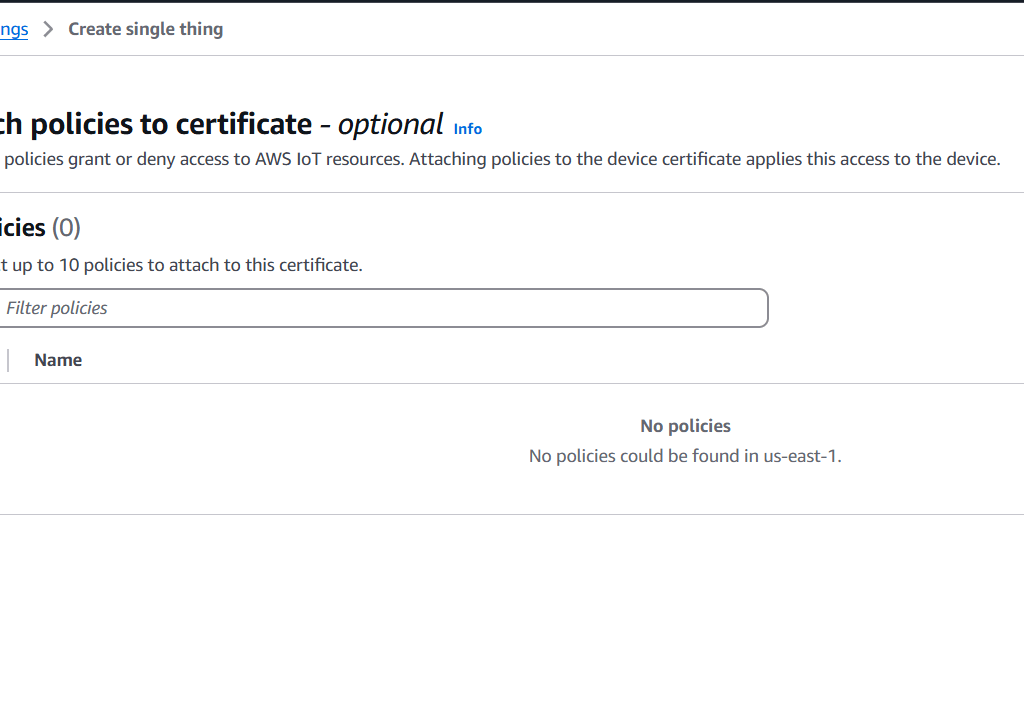
Step 1: Set Up Your AWS IoT Thing
- Go to AWS IoT Core Console.
- Create a Thing (represents your device):
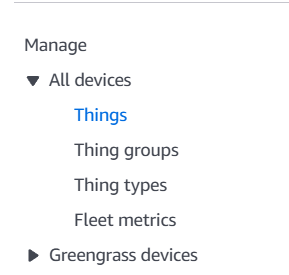
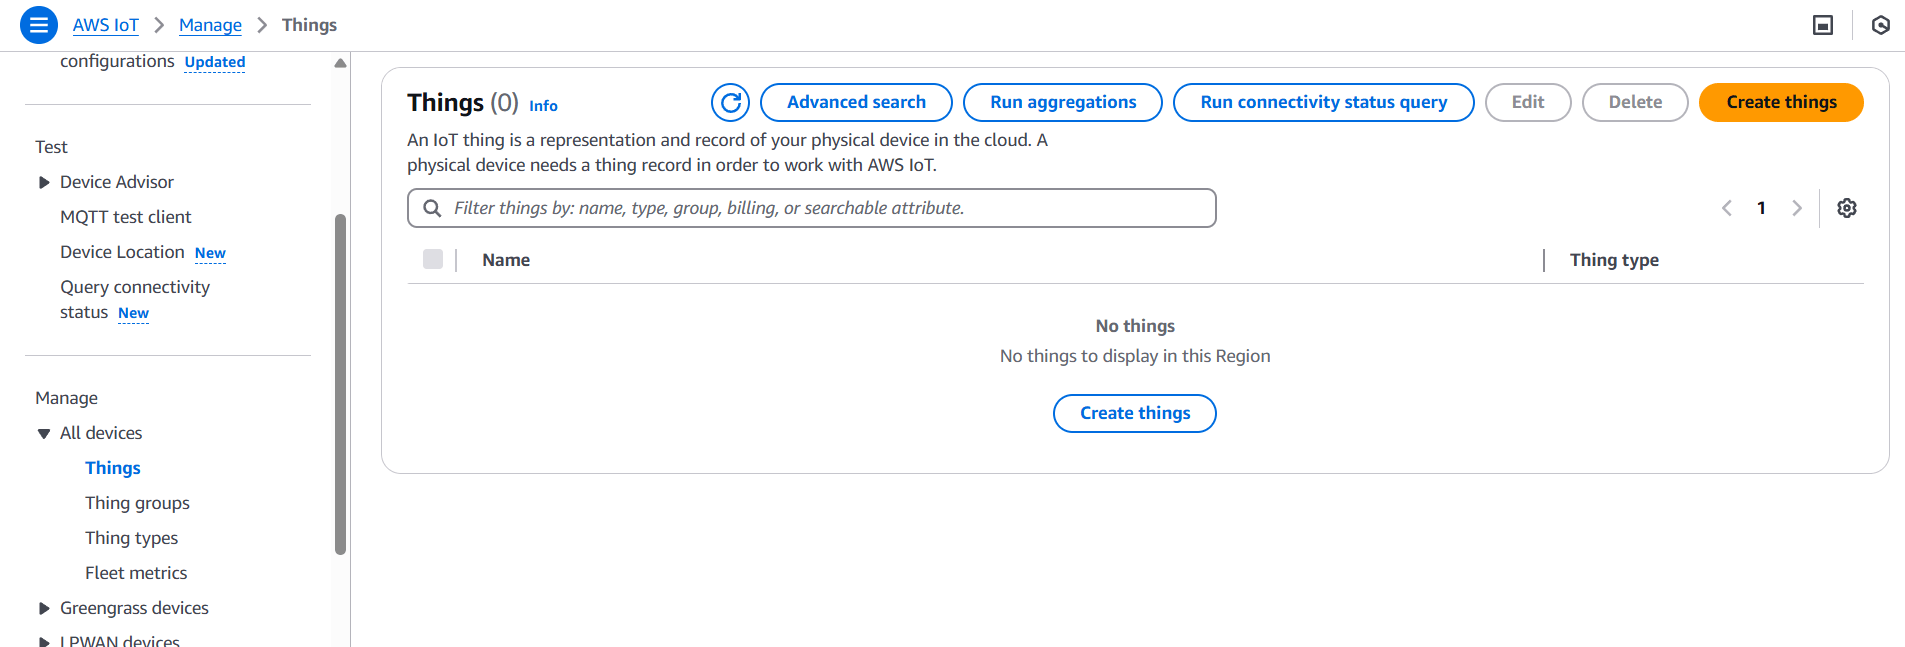
- Navigate to Manage > Things.
- Click Create Things.
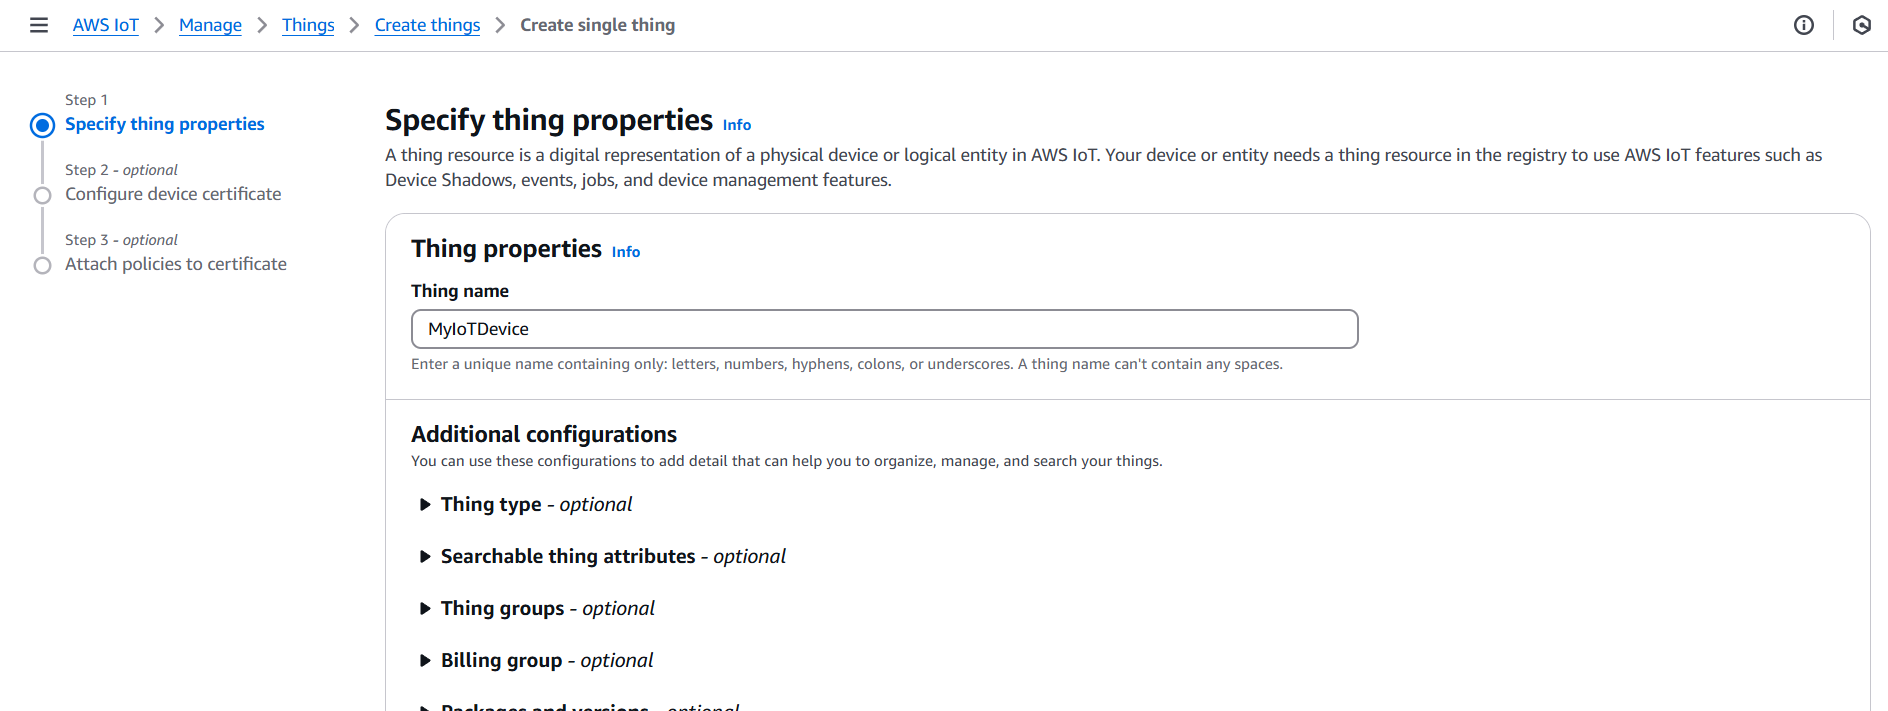
- Choose Create a single thing or Create many things.
- Give it a name (e.g.,
MyIoTDevice), and optionally define type and groups.
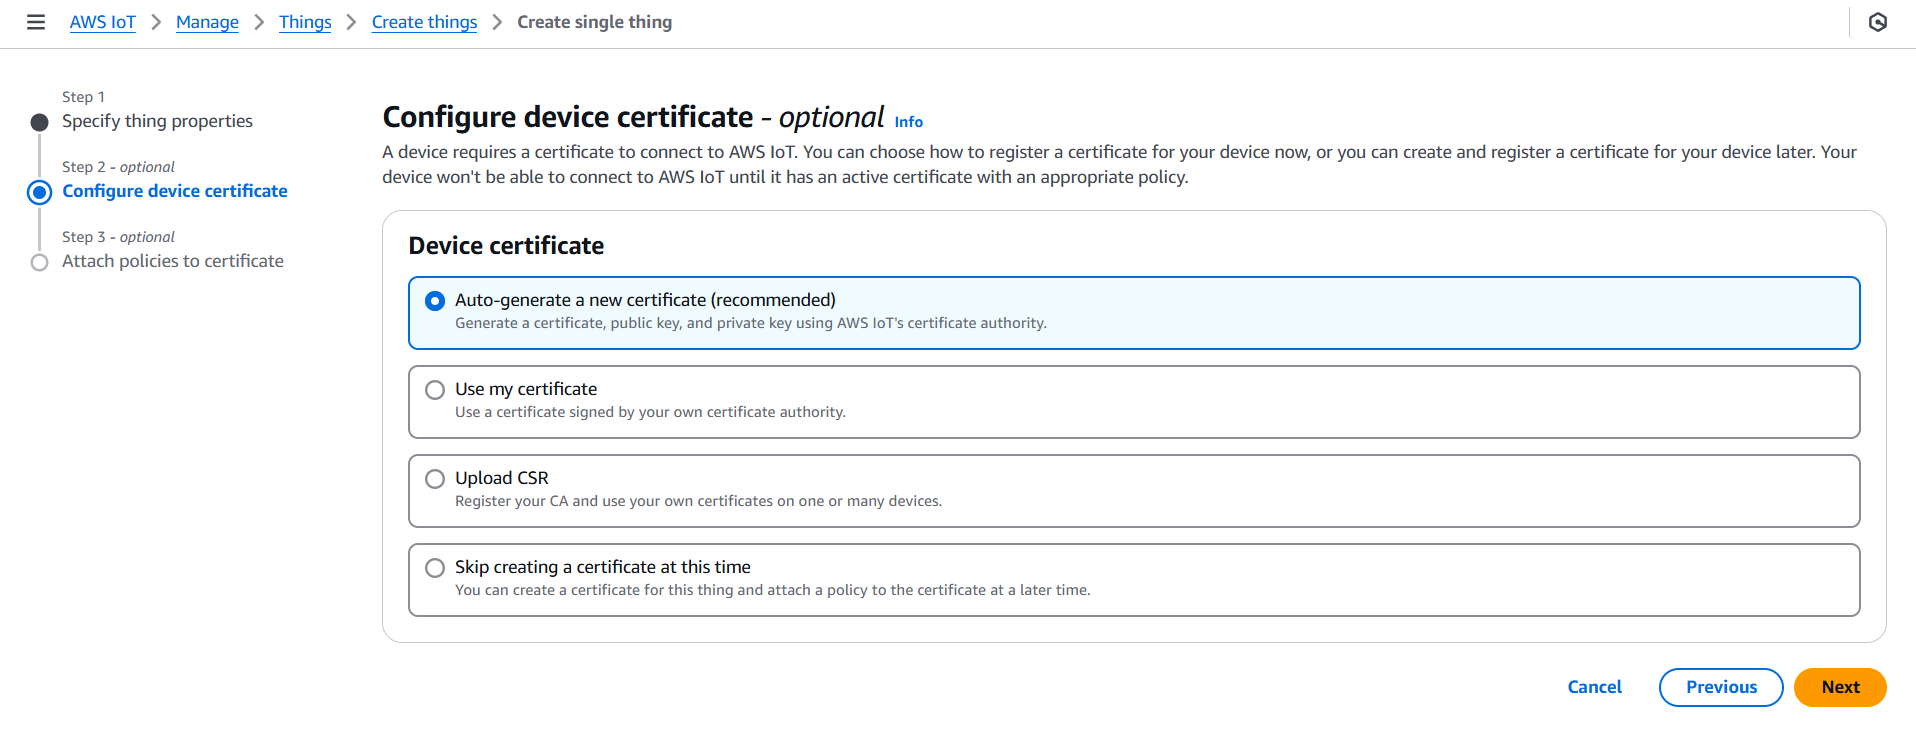
- Generate Certificates for authentication.
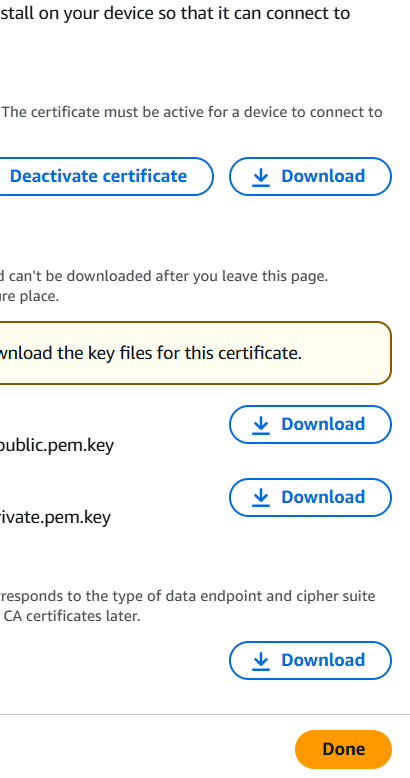
- Download the certificate, private key, and Amazon root CA.
- Attach a Policy that allows the device to connect, publish, subscribe, etc.




Step 2: Create an AWS Lambda Function
- Go to the AWS Lambda Console.
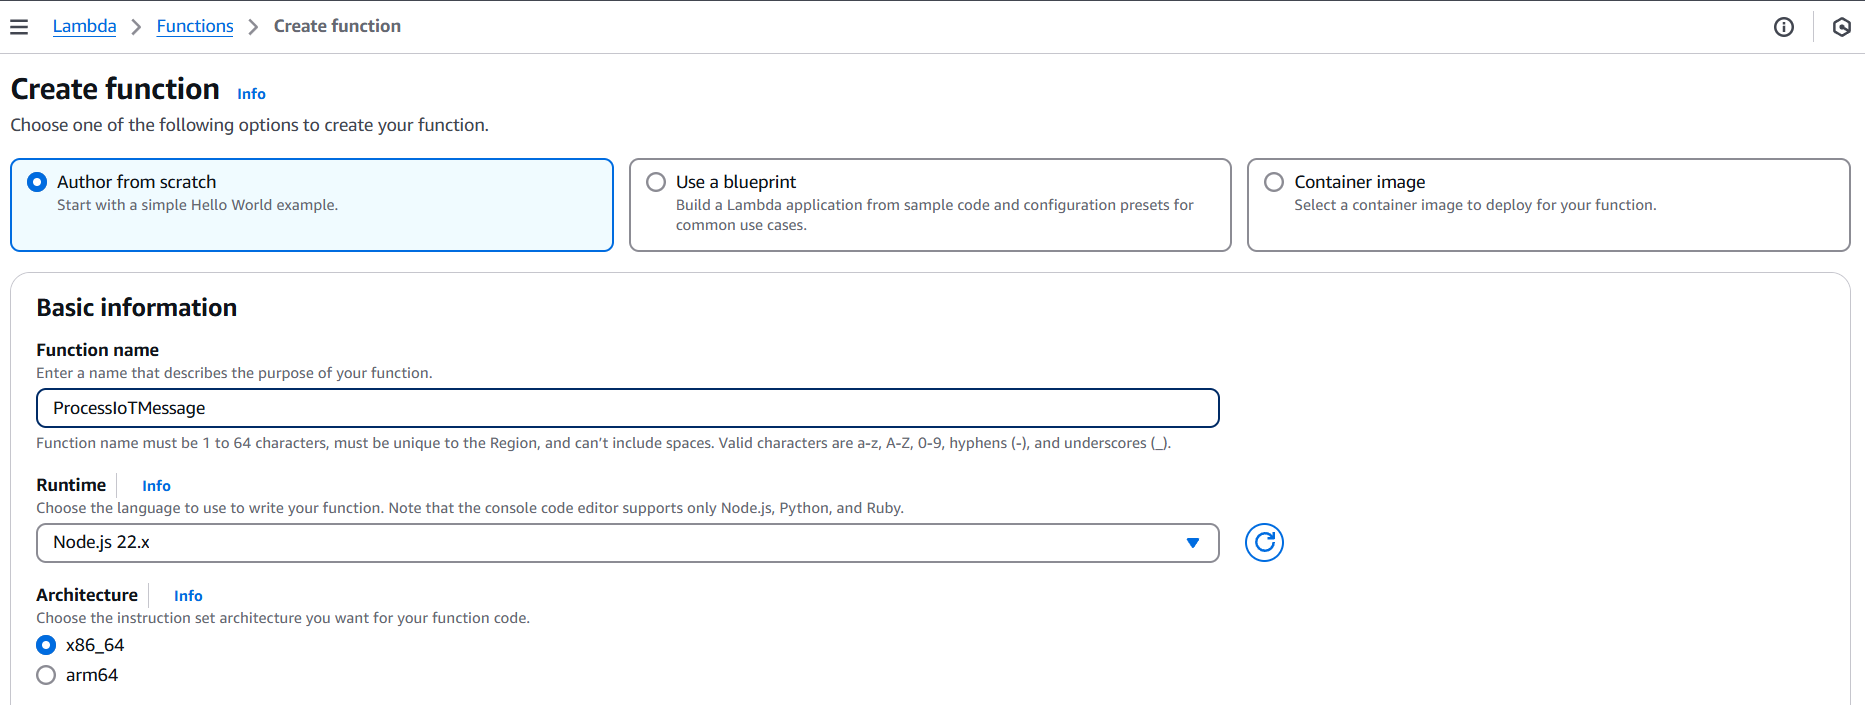
- Click Create function.
- Choose:
- Author from scratch
- Function name (e.g.,
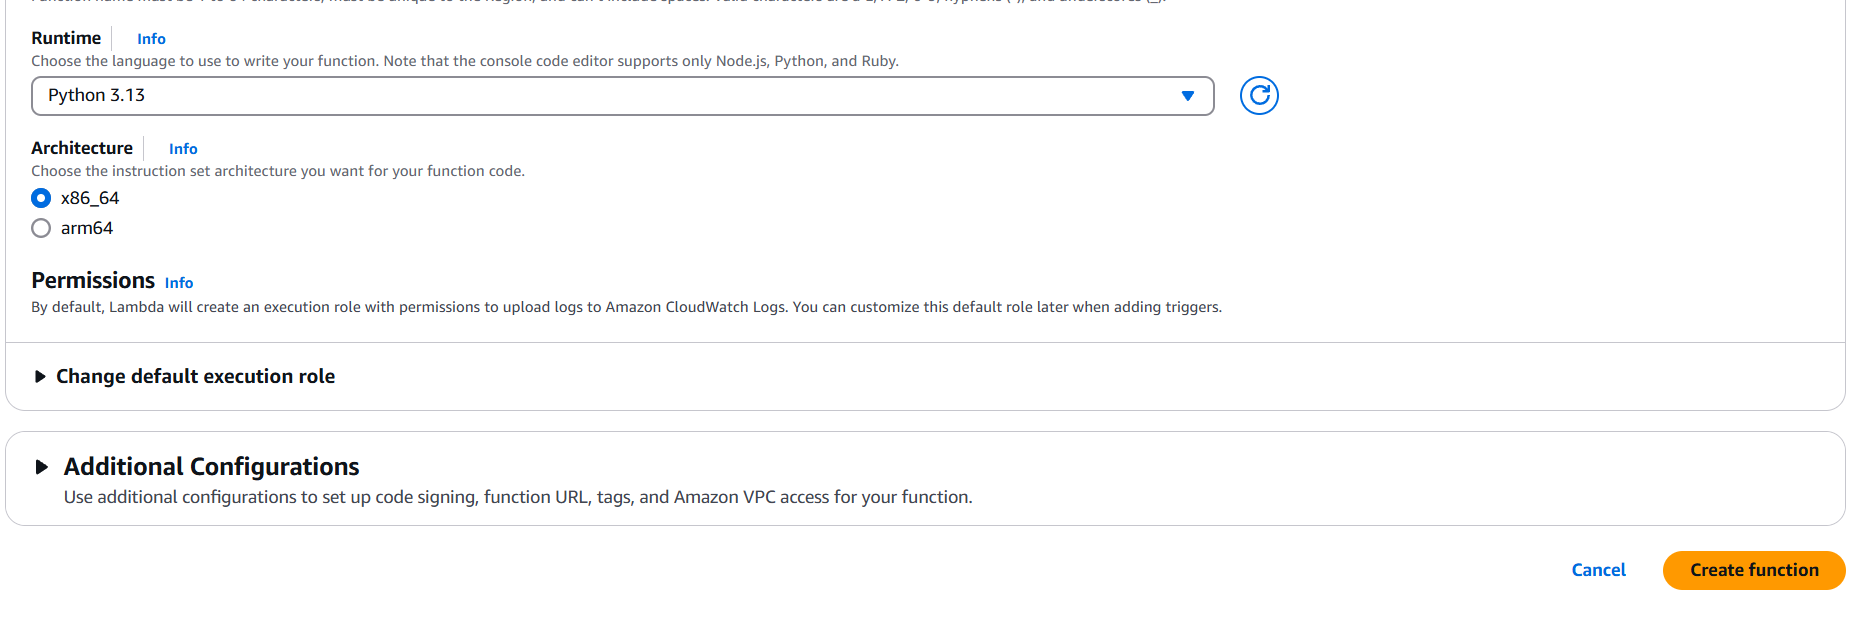
ProcessIoTMessage) - Runtime (e.g., Python, Node.js)
- Click Create function.

Add basic handler code, for example (Python):
def lambda_handler(event, context):
    print("Received event: ", event)
    return {
        'statusCode': 200,
        'body': 'Message processed.'
    }
Step 3: Add Permission for AWS IoT to Invoke Lambda
AWS IoT needs permission to invoke the Lambda function.
- Go to the Lambda function > Configuration > Permissions.
- Edit the execution role to include AWS IoT permissions:
{
  "Effect": "Allow",
  "Action": "lambda:InvokeFunction",
  "Resource": "arn:aws:lambda:<region>:<account-id>:function:ProcessIoTMessage"
}
Or let AWS IoT automatically create the permission in the next step.
Step 4: Create an AWS IoT Rule
This defines how incoming messages are routed.
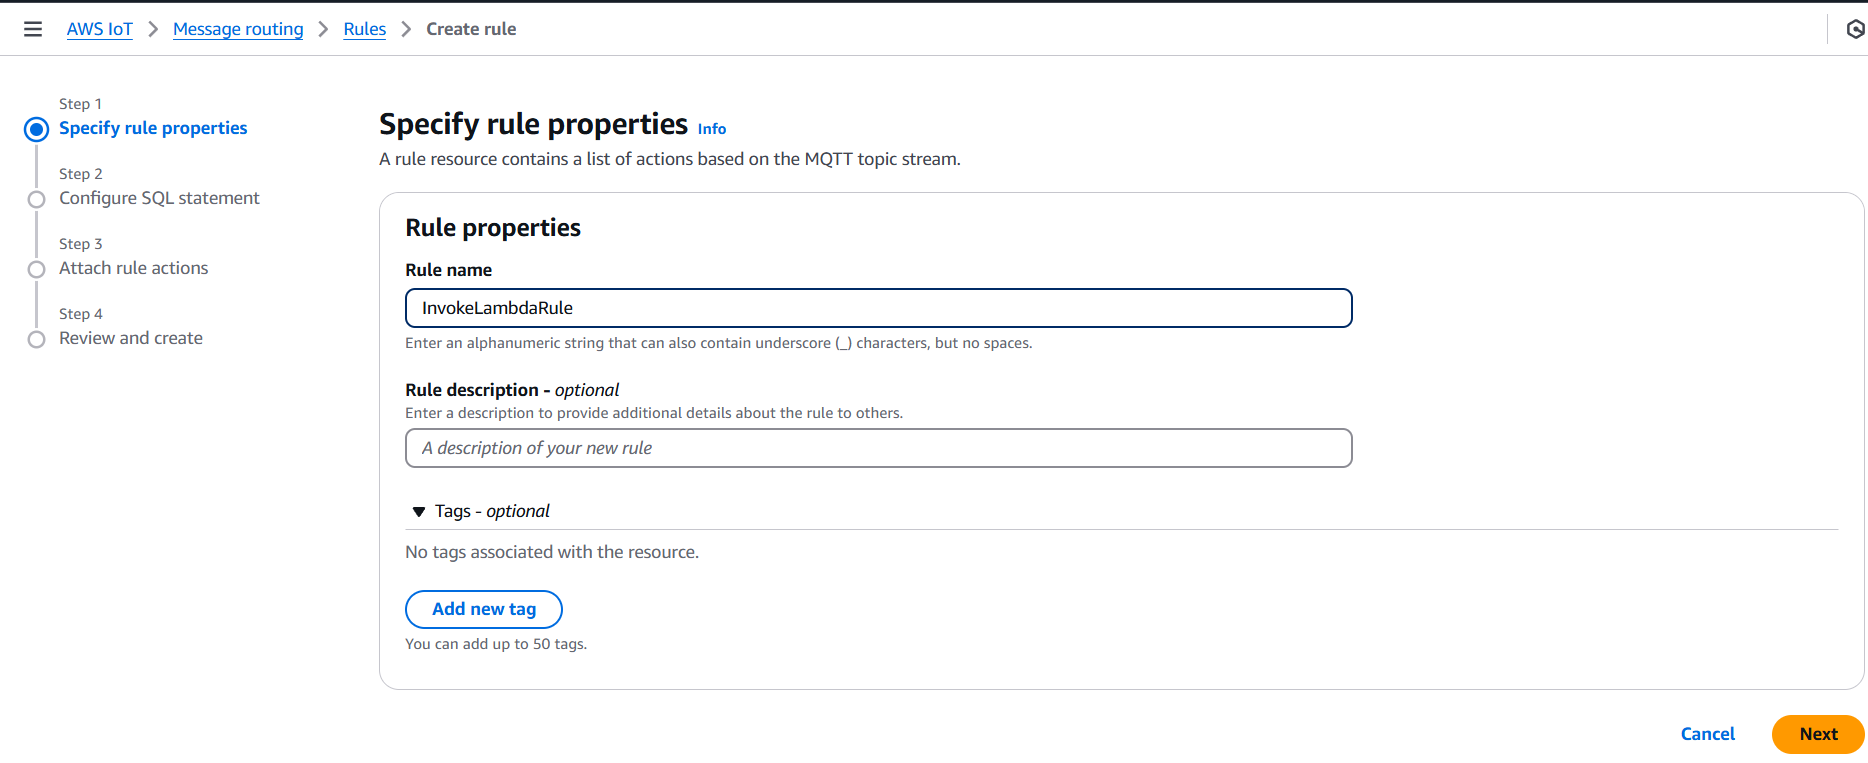
- Go to AWS IoT Core > Act > Rules.
- Click Create a rule.
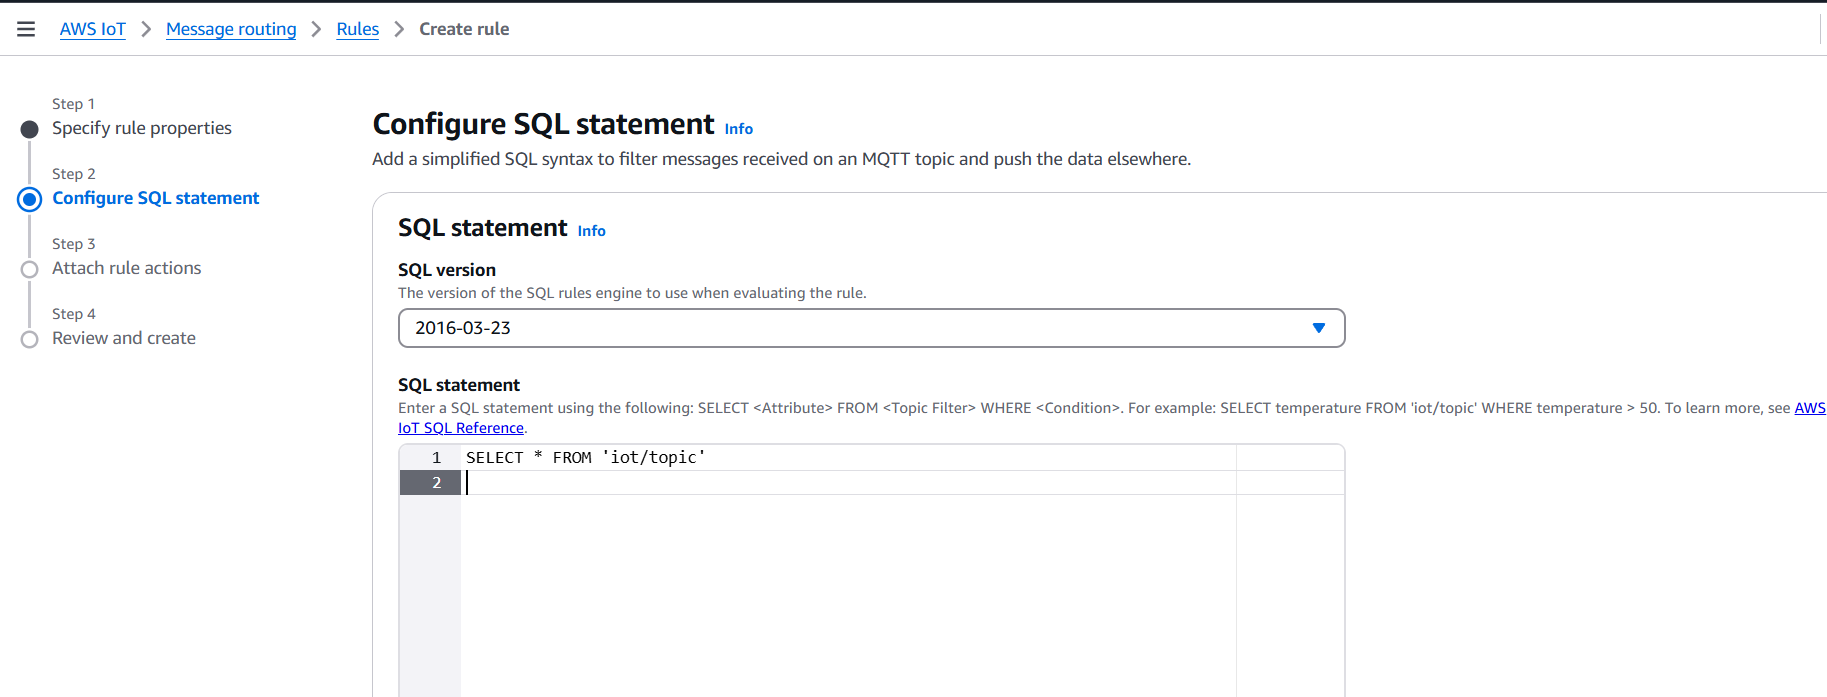
- Configure:
- Name: e.g.,
InvokeLambdaRule - SQL Statement:
- Name: e.g.,
SELECT * FROM 'iot/topic'- Replace
'iot/topic'with the actual topic you publish to.
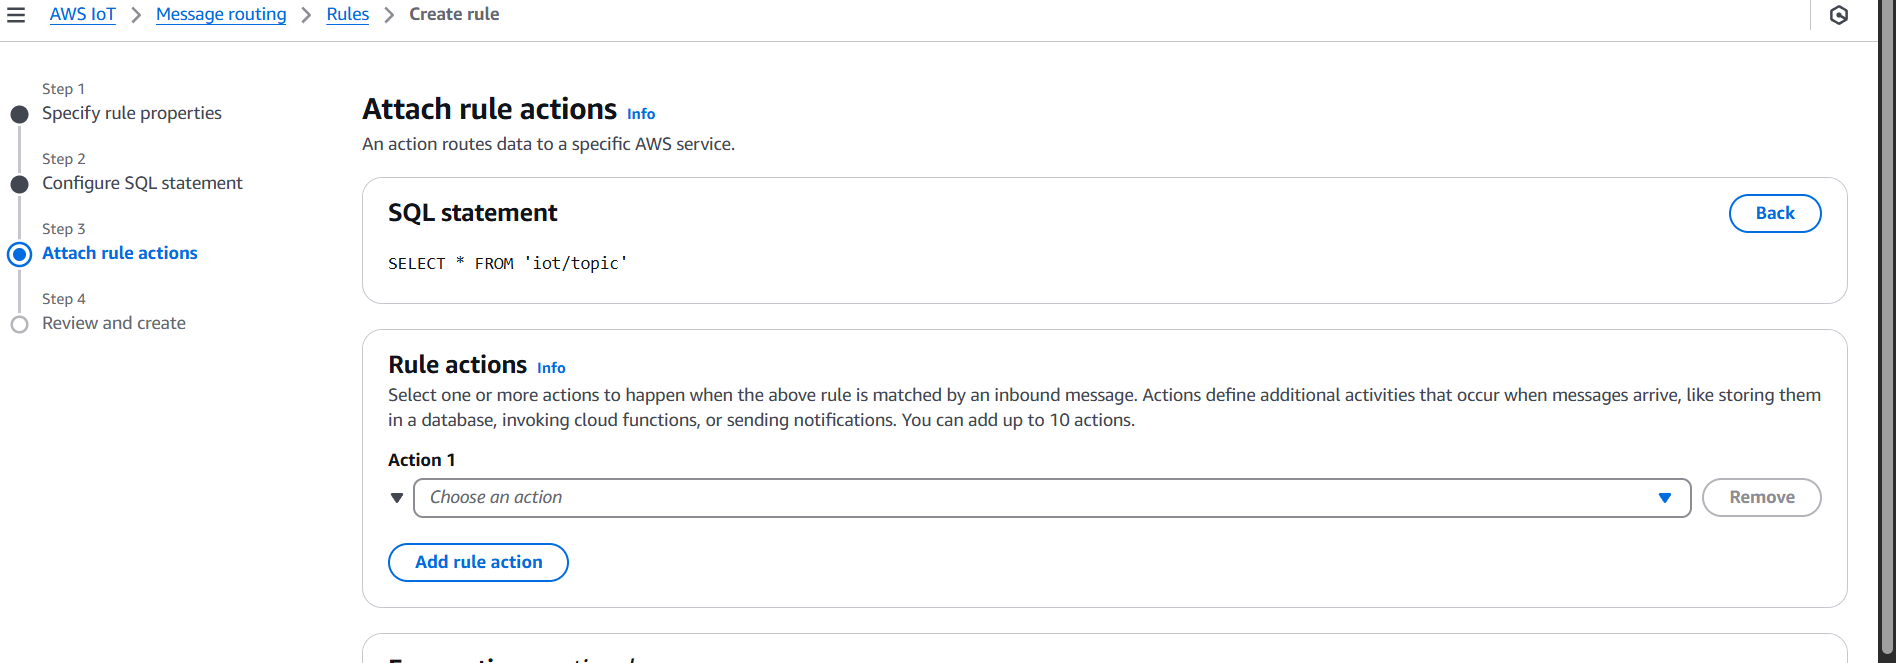
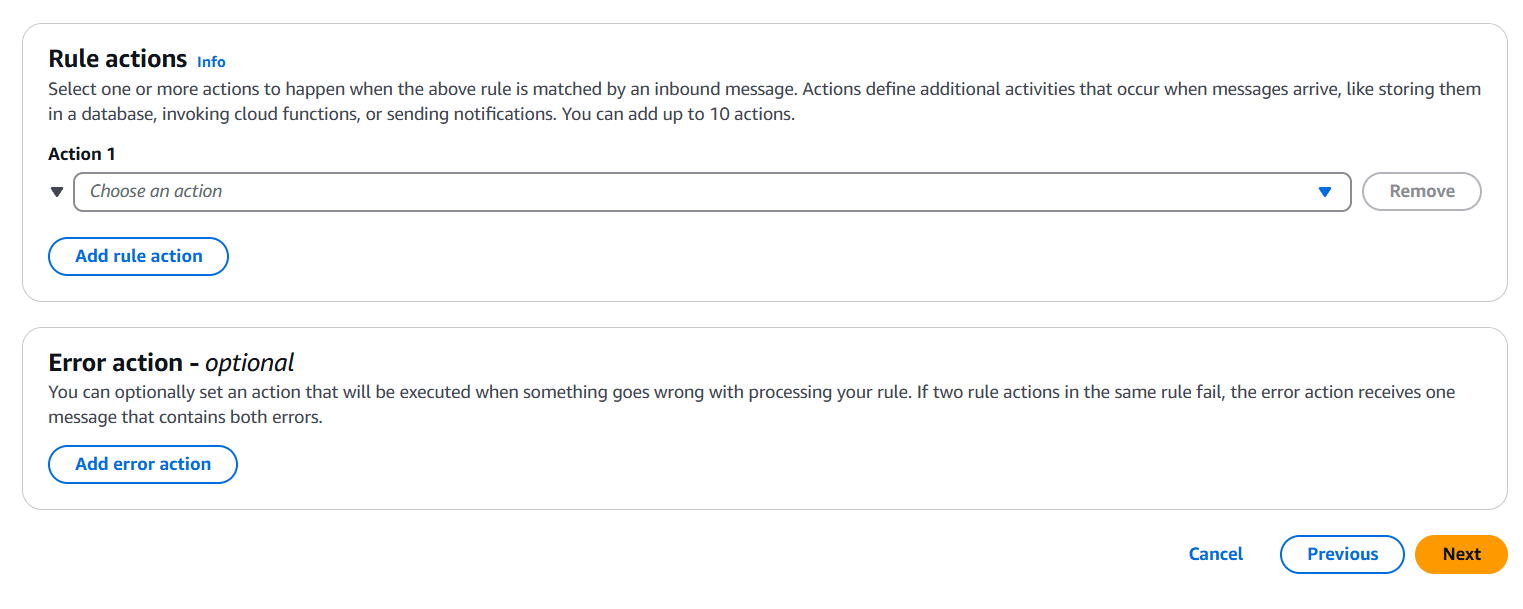
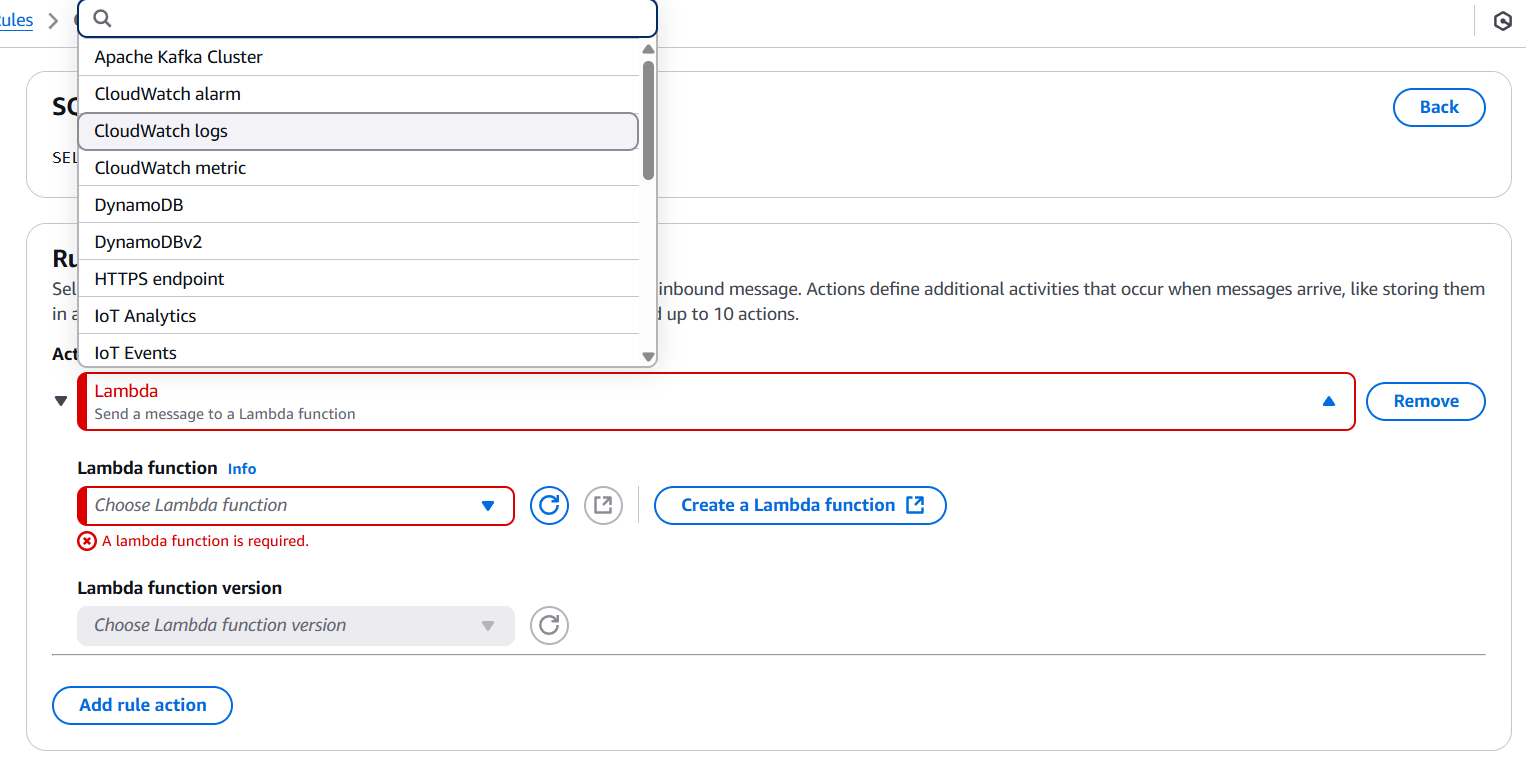
- Set action → Choose Lambda Function.
- Select the Lambda function you created.
- AWS will prompt you to grant IoT permission to invoke Lambda – accept it.
- Click Create rule.

Step 5: Test the Setup
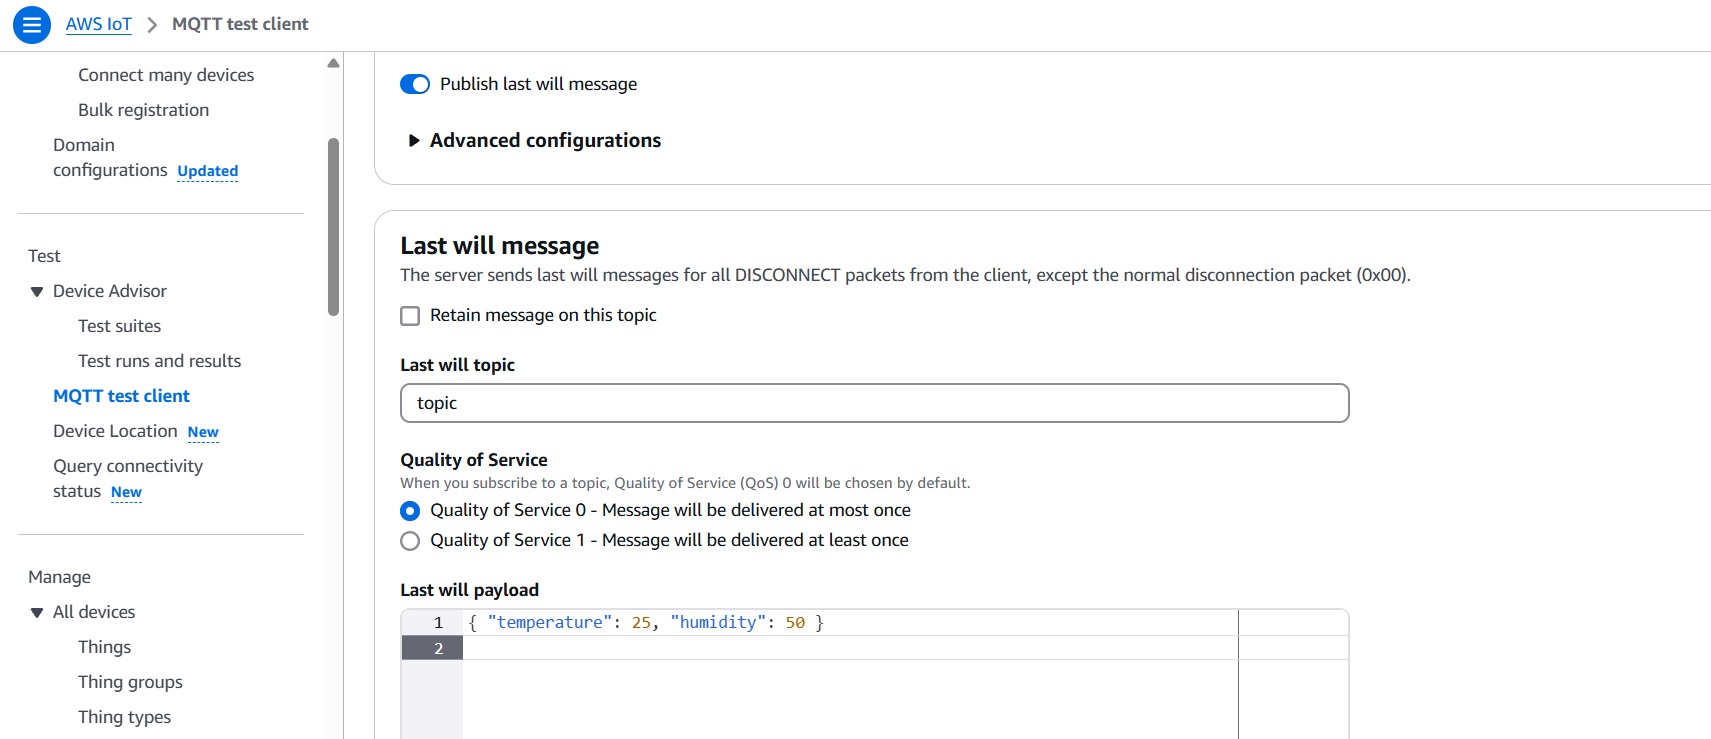
- Publish a message to the topic via MQTT test client in AWS:
- Go to AWS IoT Core > MQTT Test Client.
- Choose “Publish to a topic”.
- Enter the topic (e.g.,
iot/topic). - Enter a test payload: jsonCopyEdit
{ "temperature": 25, "humidity": 50 } - Click Publish.

- Check CloudWatch Logs for Lambda execution:
- Go to CloudWatch > Logs > Log groups > /aws/lambda/ProcessIoTMessage.

Conclusion.
In conclusion, integrating AWS IoT Core with AWS Lambda offers a powerful, serverless approach to processing and responding to IoT device messages in real time. This setup allows developers to build intelligent, scalable, and event-driven applications without the complexity of managing infrastructure. By leveraging the MQTT protocol, the IoT Rules Engine, and Lambda’s event-based compute model, businesses can transform raw device data into actionable insights, trigger workflows, and seamlessly connect to other AWS services like DynamoDB, S3, and SNS. The flexibility, security, and cost-efficiency of this architecture make it ideal for a wide range of use cases — from smart cities and home automation to industrial monitoring and logistics. As the number of connected devices continues to grow, mastering this integration will be essential for developers and organizations looking to build the next generation of IoT solutions with speed, agility, and confidence.
Step-by-Step: AWS IoT Core Integration with Amazon SNS
Introduction.
The integration of AWS IoT Core with Amazon Simple Notification Service (SNS) represents a powerful solution for enabling real-time, event-driven messaging from IoT devices to end-users or systems. AWS IoT Core is a managed cloud service that lets connected devices easily and securely interact with cloud applications and other devices. It facilitates the collection, processing, and analysis of data generated by sensors, devices, and microcontrollers that are part of the Internet of Things (IoT). On the other hand, Amazon SNS is a fully managed pub/sub messaging and mobile notification service that enables the decoupling of microservices and the distribution of information to multiple subscribers efficiently. By integrating AWS IoT Core with Amazon SNS, developers can create intelligent IoT applications that send alerts or notifications in real-time based on the data or state changes reported by devices. This integration is particularly useful in industrial monitoring, smart homes, fleet tracking, health monitoring systems, and more—any use case where timely alerts are crucial. For example, if a temperature sensor reports a value above a certain threshold, an SNS topic can trigger an SMS or email notification to a technician.
The process starts by configuring an SNS topic to act as the destination for alerts or messages. After setting up the topic and subscribing endpoints (such as email addresses or phone numbers), the next step involves defining a rule in AWS IoT Core. These rules evaluate device messages using a SQL-like syntax to determine whether a particular action should be taken. If the criteria match, the action invokes the SNS topic using a predefined IAM role with sufficient permissions. This IAM role acts as a secure bridge that allows AWS IoT Core to publish messages to the SNS topic. Messages are then pushed to the subscribed users or services instantly.
This integration offers a scalable and secure architecture that supports millions of connected devices and numerous concurrent notifications. It offloads the complexity of managing infrastructure and messaging queues, letting developers focus on business logic and innovation. Additionally, with built-in support for MQTT, HTTP, and WebSockets, AWS IoT Core ensures that devices can communicate efficiently using lightweight protocols, even over unreliable networks. Amazon SNS supports multiple notification formats, including SMS, email, Lambda function calls, and HTTP endpoints, giving developers the flexibility to build versatile notification systems. Furthermore, fine-grained access control via AWS IAM and message filtering via SNS subscription policies allows for precise targeting and security. The result is a robust, real-time alerting and notification system that bridges the physical world of devices with the digital world of users and cloud applications. Overall, integrating AWS IoT Core with SNS greatly simplifies the process of building reactive, event-driven IoT solutions that respond instantly to changes in the environment.

Prerequisites
- AWS account
- An IoT Thing registered in AWS IoT Core
- Basic familiarity with AWS Console
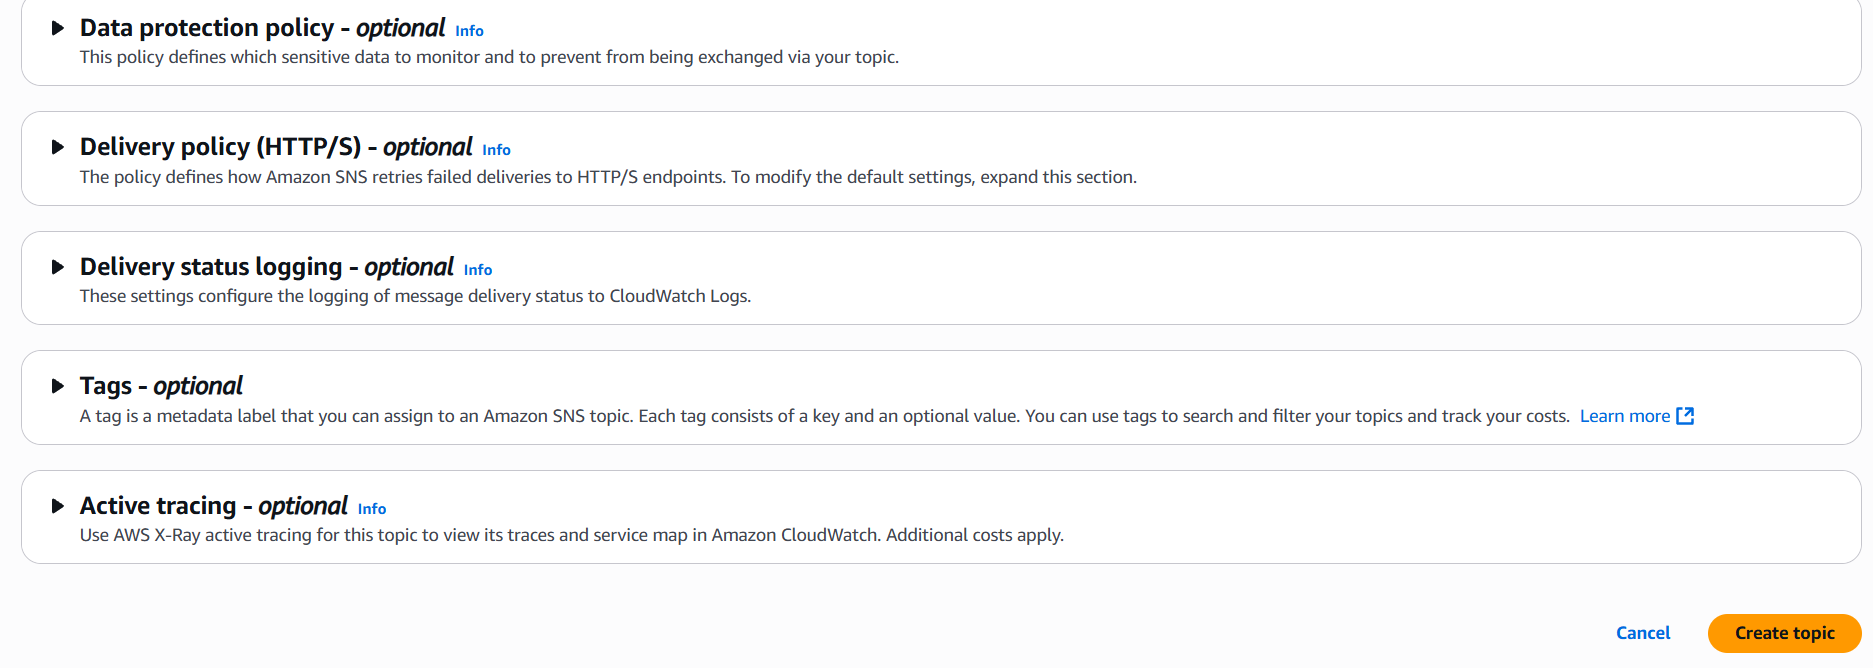
Step 1: Create an SNS Topic
- Go to the Amazon SNS console: https://console.aws.amazon.com/sns/
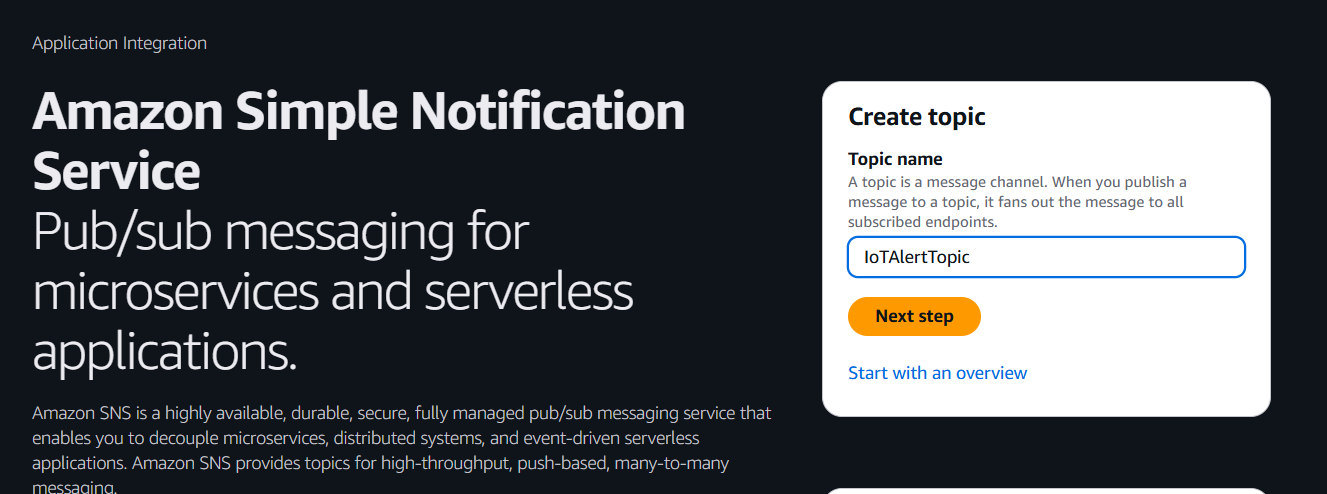
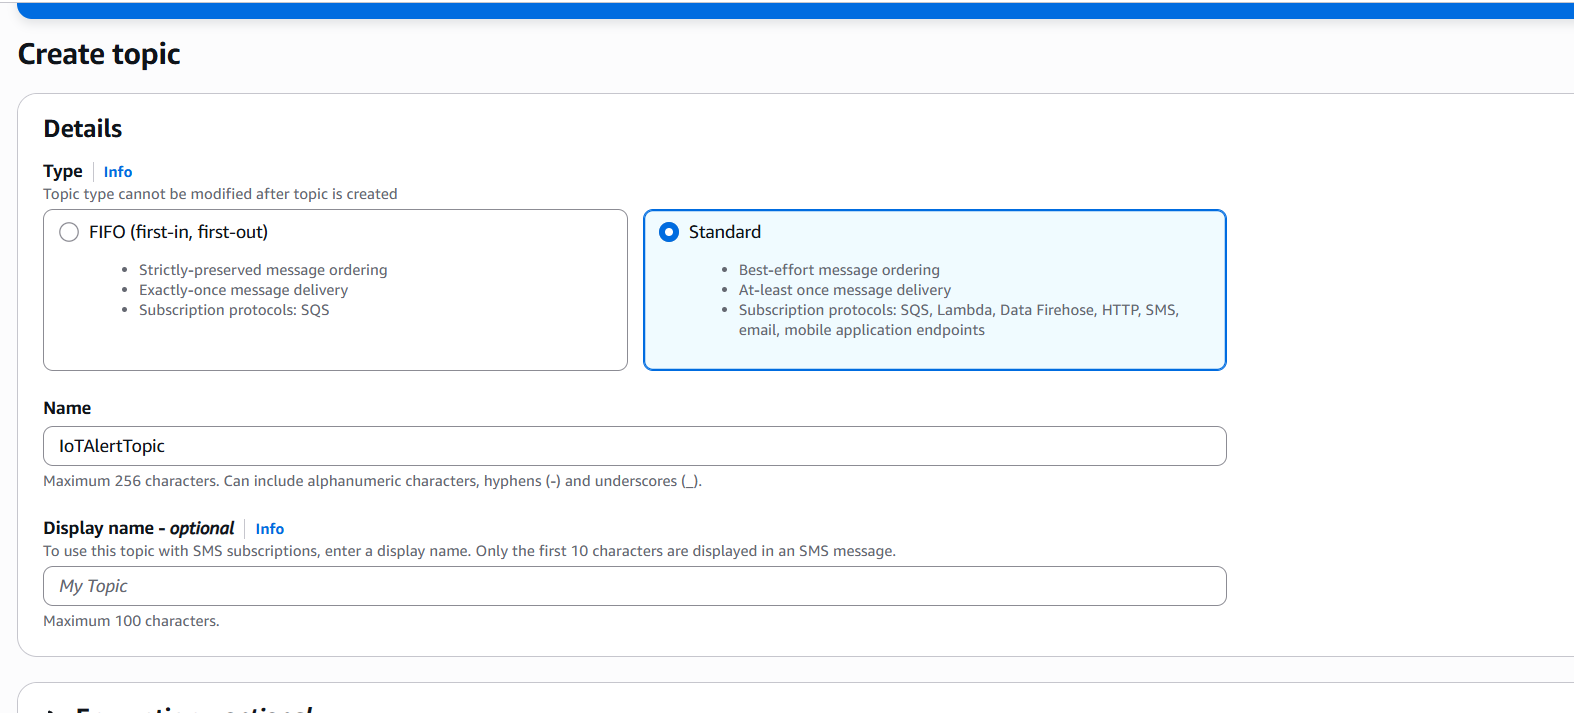
- Click Topics > Create topic
- Choose Standard as the type
- Name the topic (e.g.,
IoTAlertTopic) - Click Create topic
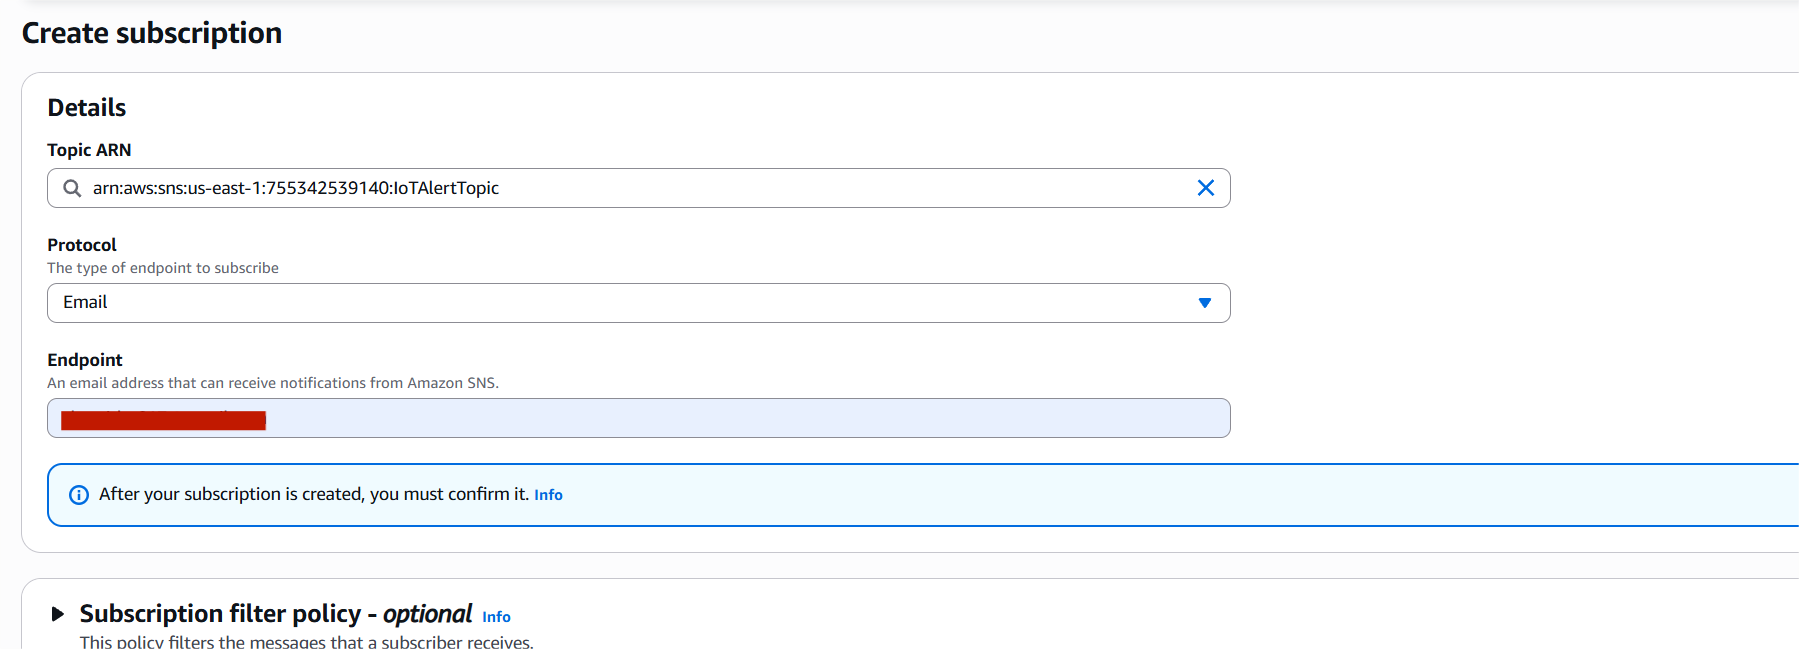
Step 2: Subscribe to the SNS Topic
- Open the topic you just created
- Click Create subscription
- Choose Protocol (e.g., Email, SMS, Lambda, etc.)
- Enter the endpoint (e.g., your email address for email)
- Click Create subscription
- Confirm the subscription (for email/SMS, check your inbox and click the confirmation link)


Step 3: Create an IAM Role for AWS IoT to Publish to SNS
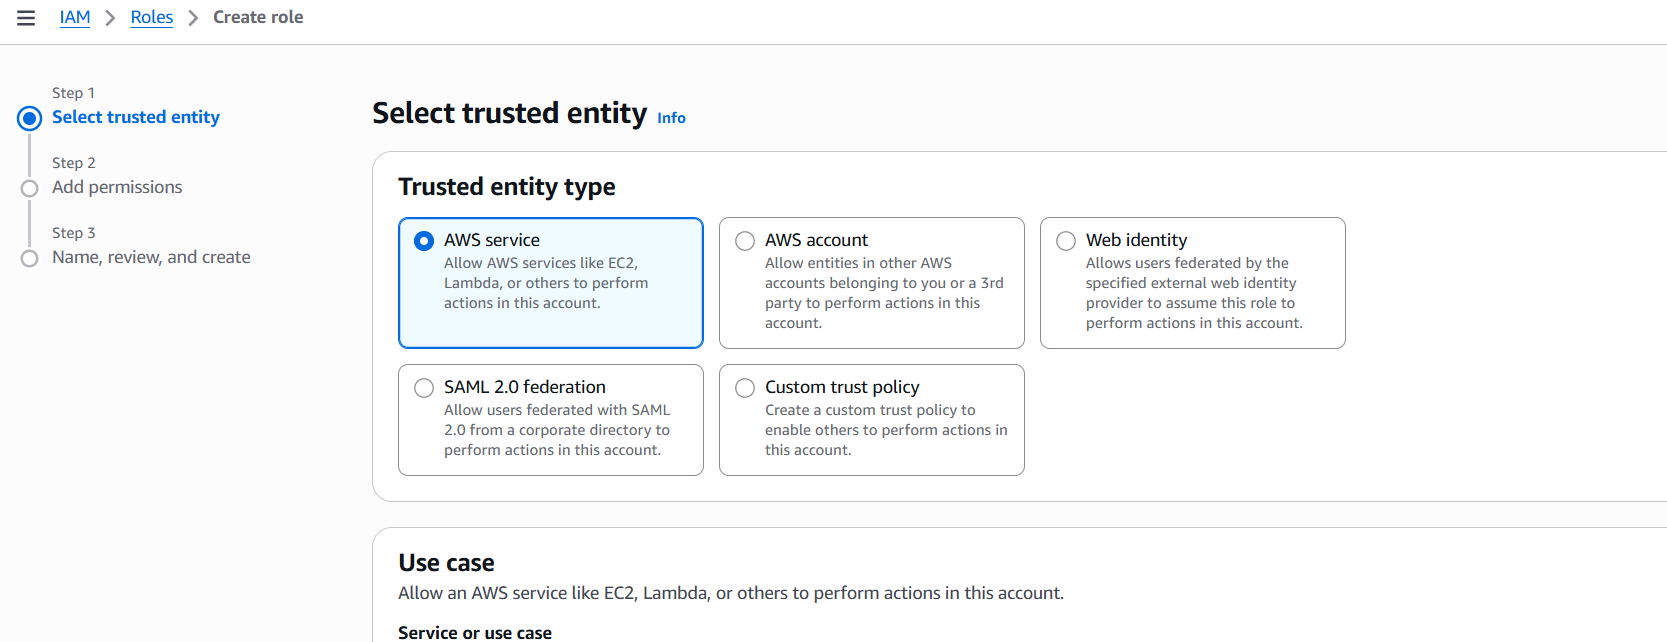
- Go to IAM Console > Roles > Create role
- Trusted entity type: Choose AWS service
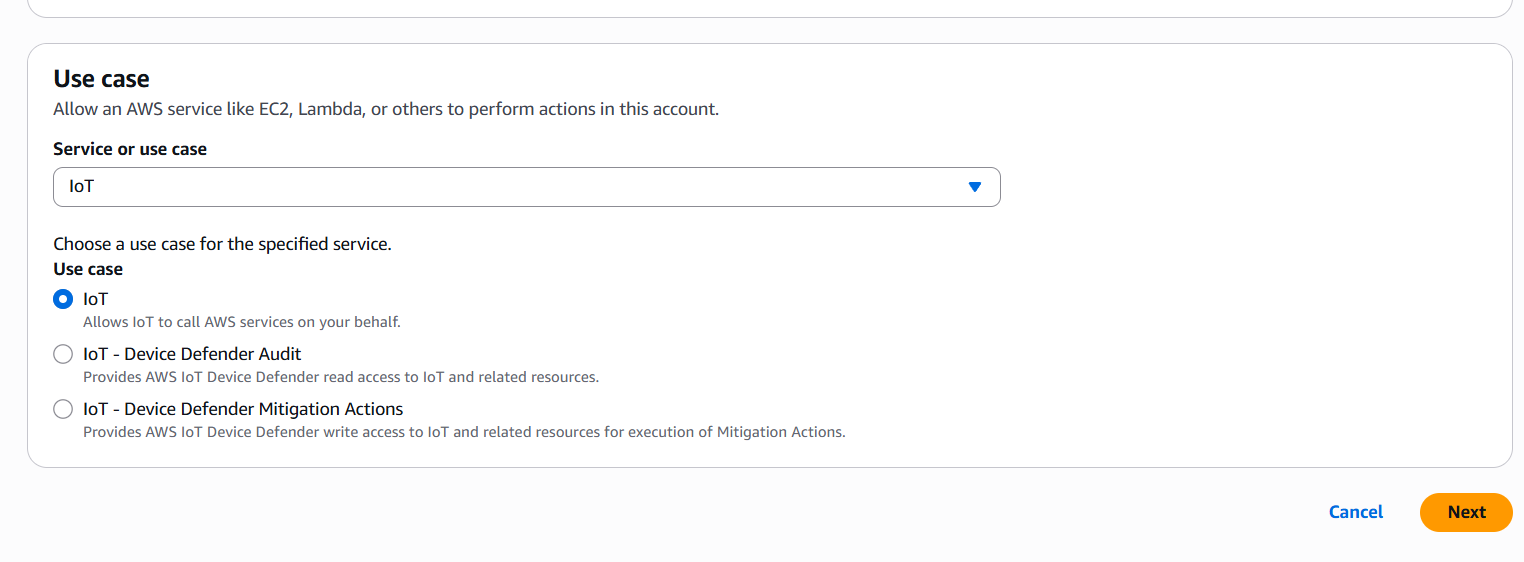
- Use case: Choose IoT
- Click Next
- Attach the following policy (or create a custom one):
{
  "Version": "2012-10-17",
  "Statement": [
    {
      "Effect": "Allow",
      "Action": "sns:Publish",
      "Resource": "arn:aws:sns:REGION:ACCOUNT_ID:IoTAlertTopic"
    }
  ]
}
Name the role (e.g., IoT_SNS_Publish_Role) and click Create role

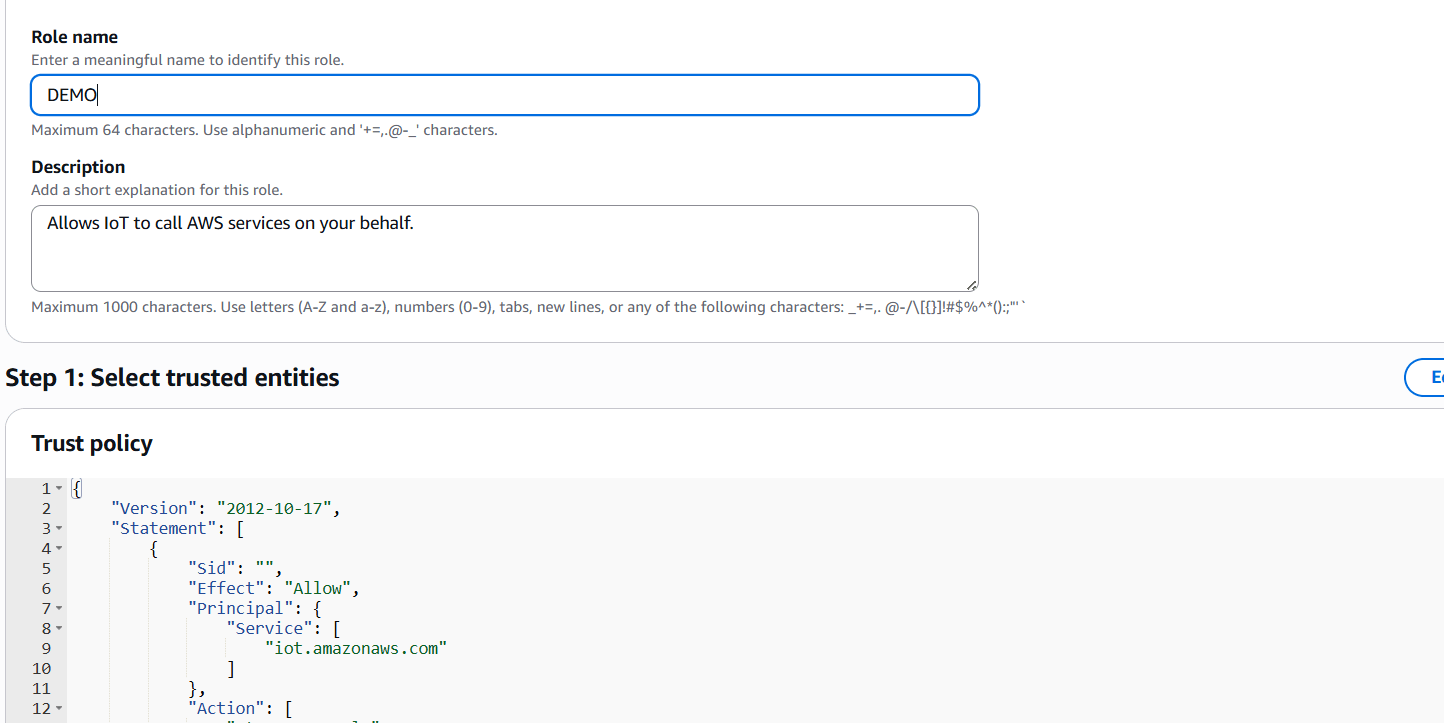

Step 4: Create an AWS IoT Rule
- Go to AWS IoT Core Console
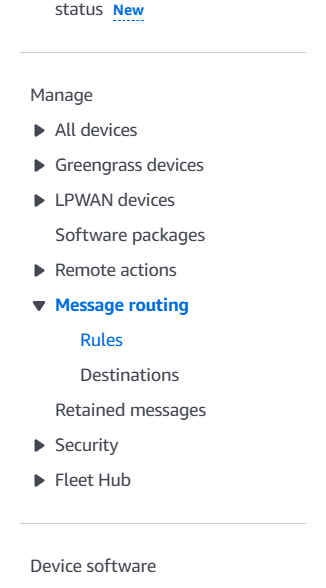
- Navigate to Message Routing > Rules
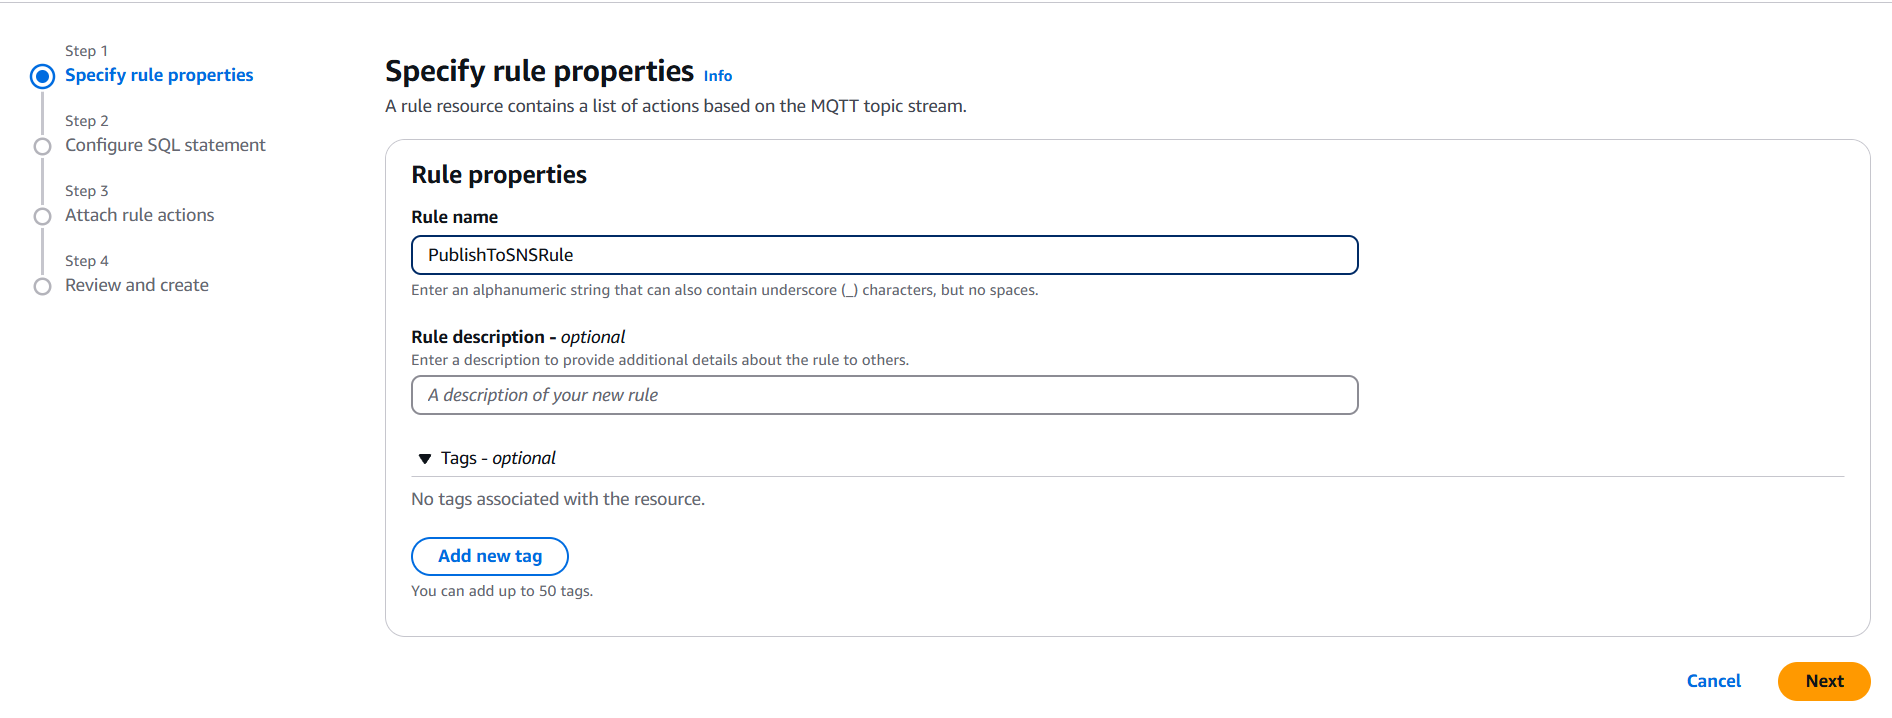
- Click Create rule
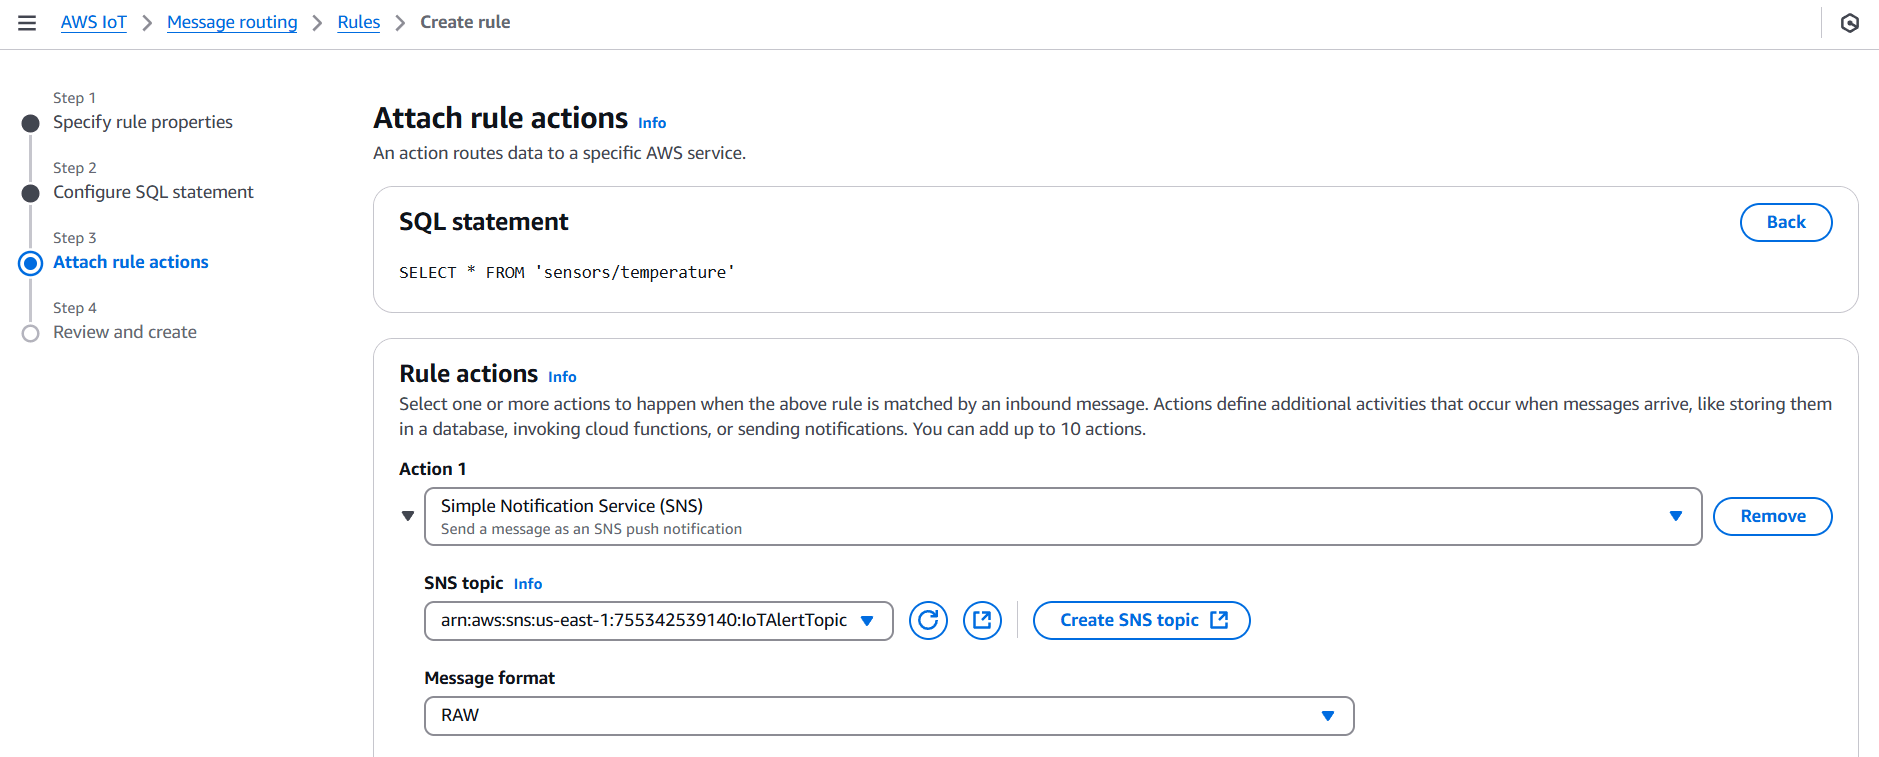
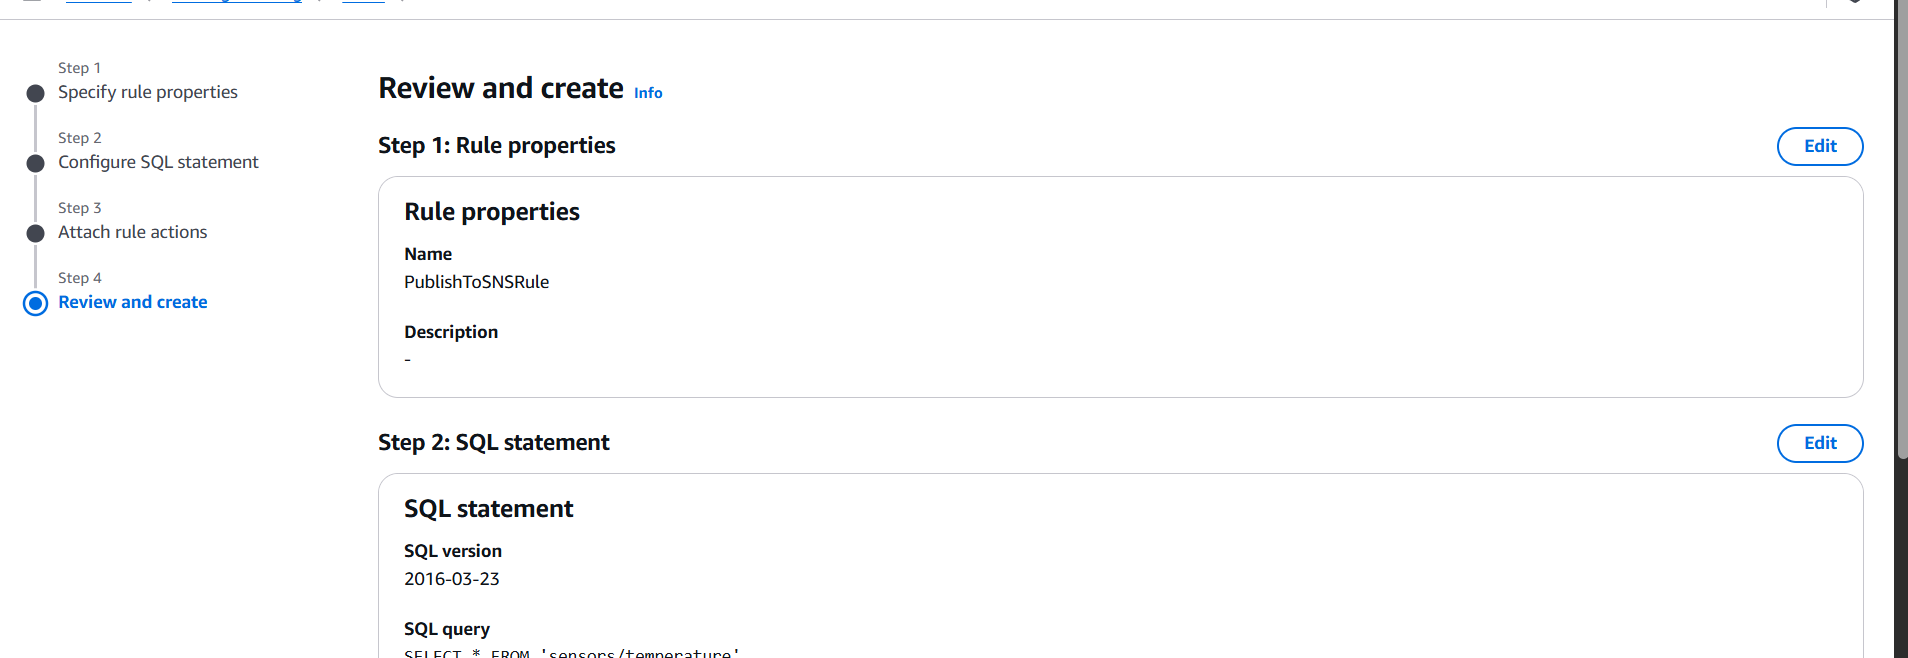
- Enter a Name (e.g.,
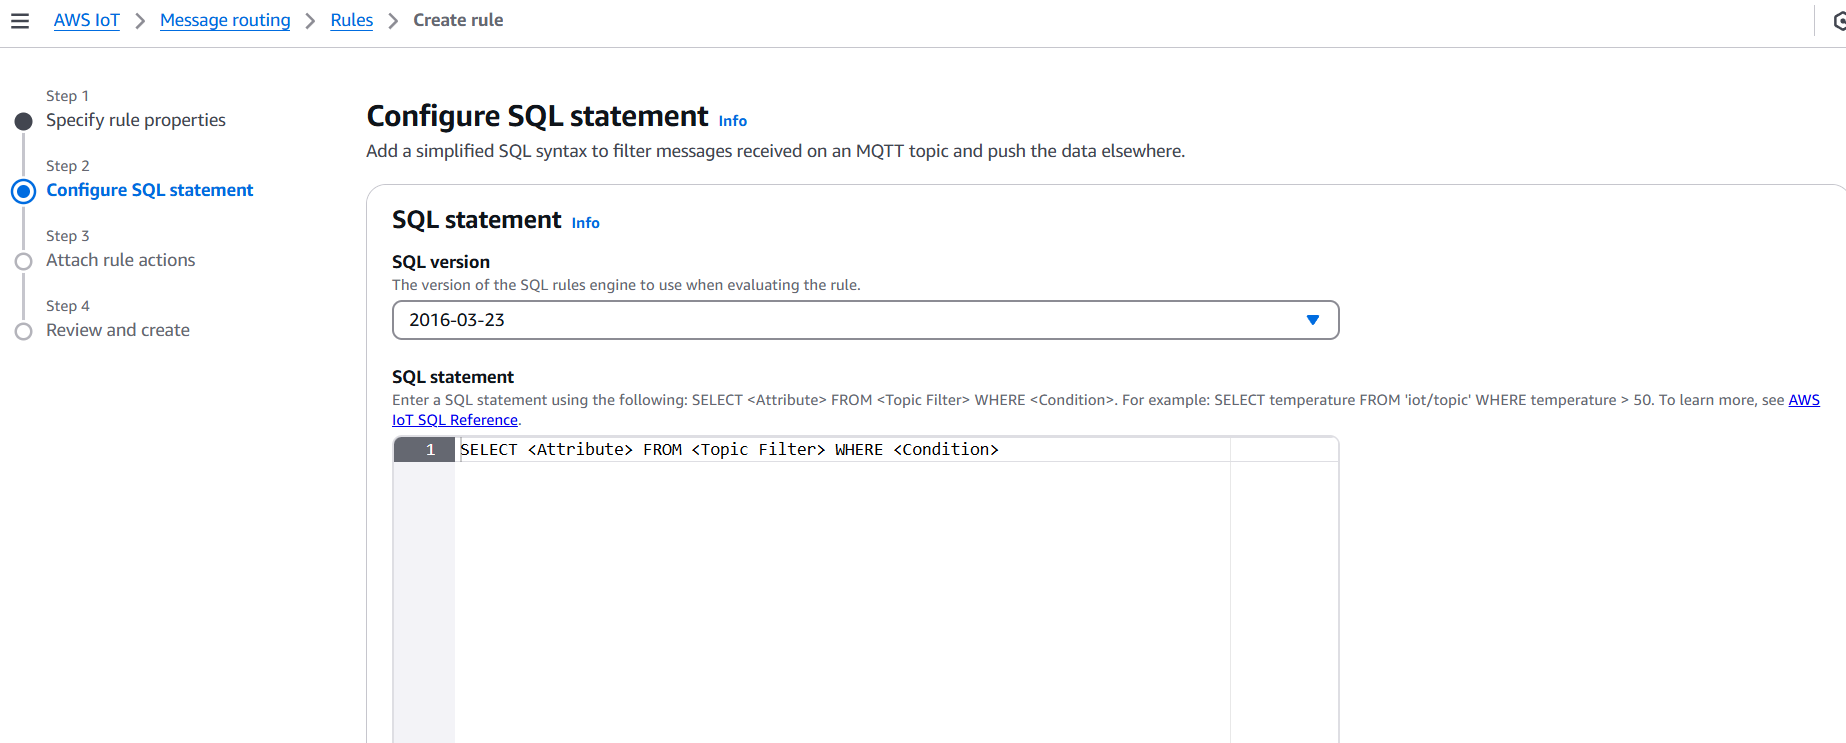
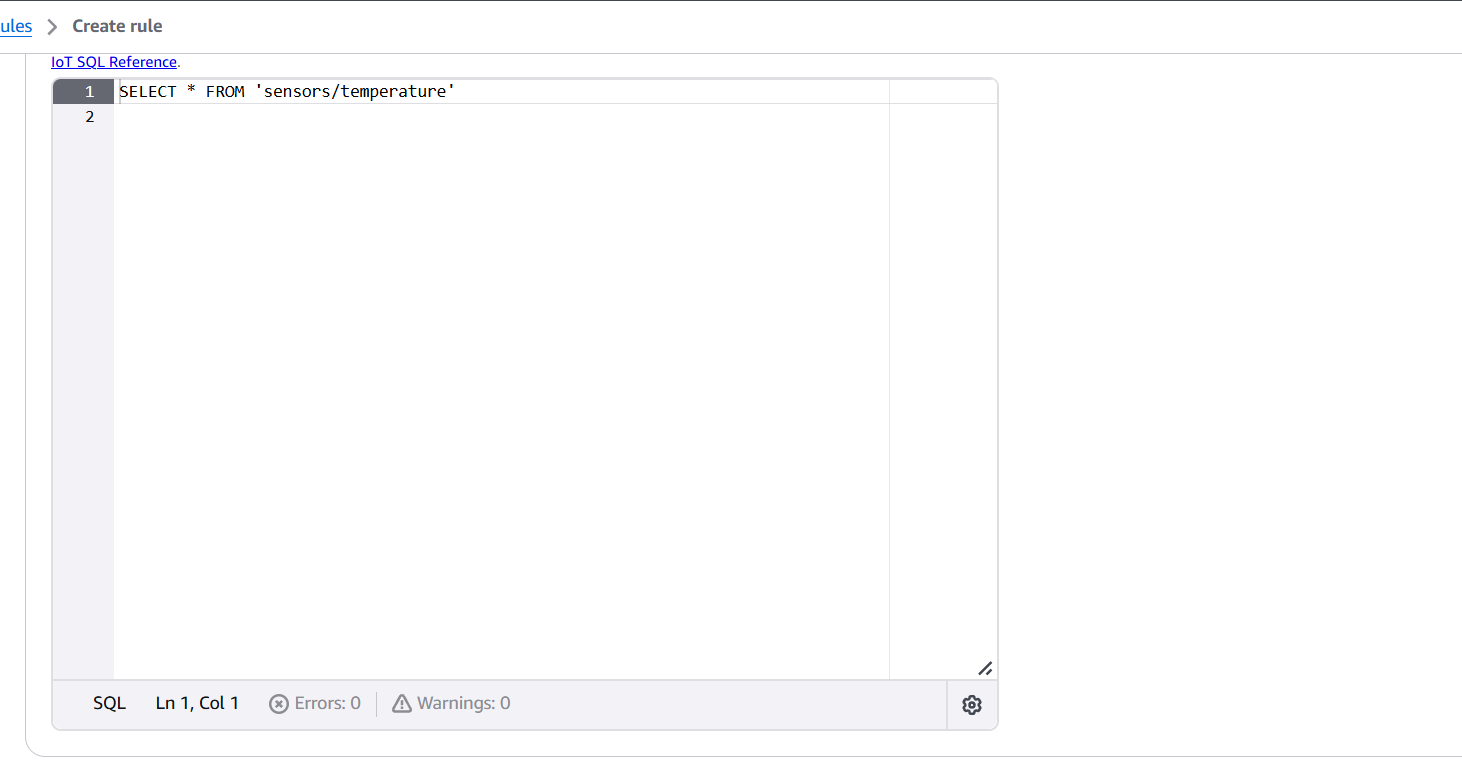
PublishToSNSRule) - Rule query statement: Use an SQL-like expression, e.g.:
SELECT * FROM 'sensors/temperature'- Under Set one or more actions, click Add action
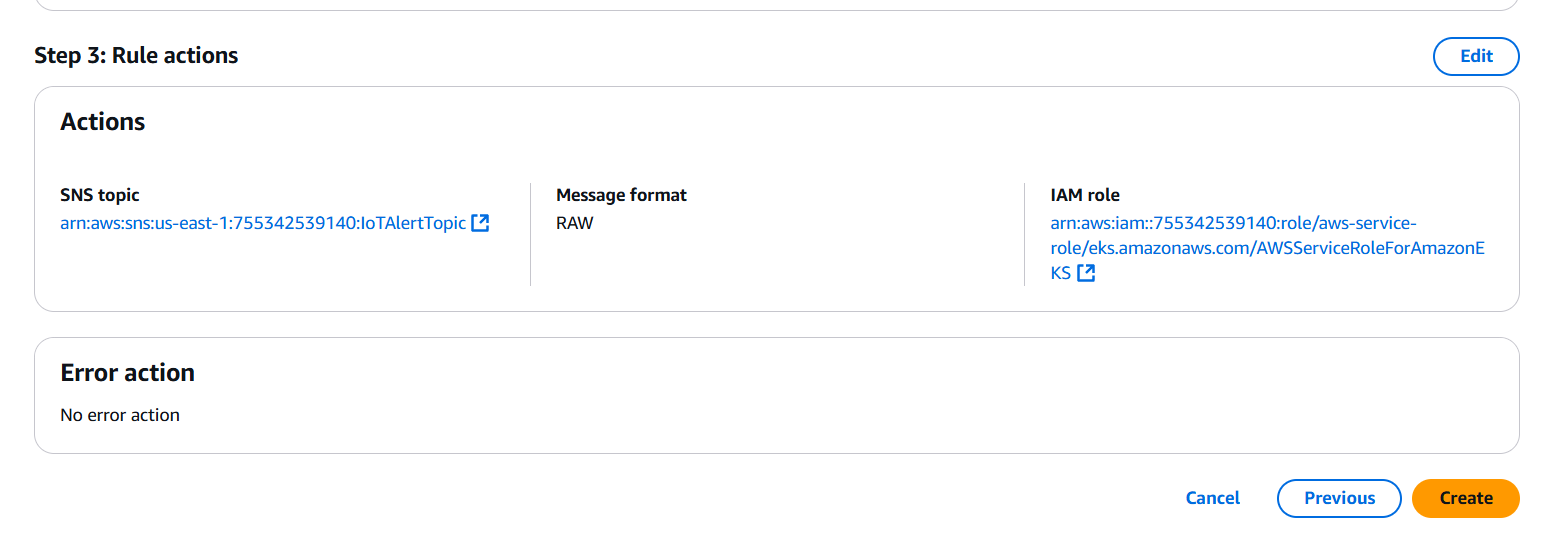
- Choose Send a message as an SNS push notification
- Select the SNS topic you created
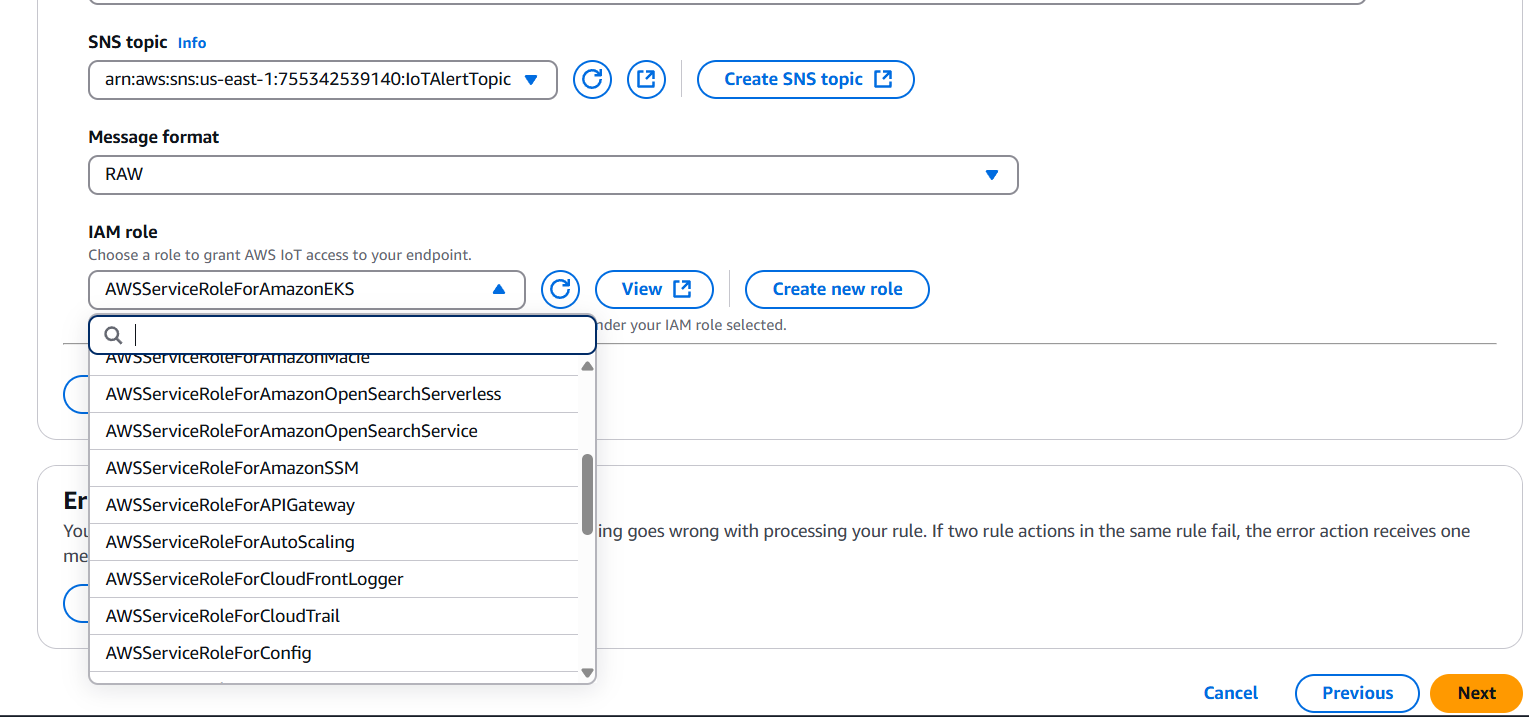
- Choose the role you created (
IoT_SNS_Publish_Role) - Click Add action
- Click Create rule


Step 5: Test the Integration
- Publish a message from your device or the MQTT test client in AWS:
- Topic:
sensors/temperature - Message:
{ "temperature": 85 }
- Topic:
- If the rule matches, AWS IoT will invoke the SNS action.
- You’ll receive a notification (e.g., an email or SMS) through SNS.
Done! You now have AWS IoT Core sending notifications through Amazon SNS.

Conclusion.
In conclusion, integrating AWS IoT Core with Amazon SNS offers a highly effective, scalable, and secure way to build real-time notification systems driven by IoT data. This setup empowers organizations to automate alerts, monitor device states, and respond to events as they happen—without the need for constant manual oversight. By using AWS IoT rules to filter and process messages and leveraging SNS to distribute those messages across a wide range of protocols (such as email, SMS, mobile push, or HTTP endpoints), developers can ensure that critical information reaches the right people or systems instantly. The use of IAM roles ensures secure communication between services, while SNS’s flexibility allows for multiple subscription types and easy expansion as the application grows.
Whether used in smart homes, industrial automation, logistics, agriculture, or healthcare, this integration enables actionable intelligence and reduces operational latency. It streamlines the flow of information from edge devices to decision-makers or automated processes, enhancing responsiveness and reliability. As organizations continue to deploy IoT devices at scale, the combination of AWS IoT Core and Amazon SNS provides a future-proof foundation for building reactive, data-driven applications that can alert, inform, and act without delay. Ultimately, this integration highlights the power of combining IoT connectivity with cloud-based messaging to create dynamic, event-aware systems that improve efficiency and user experience.
Jenkins Parameters Demystified: A Beginner-Friendly Tutorial.
Introduction.
In the ever-evolving world of software development and DevOps, automation is a cornerstone of productivity and efficiency. Jenkins, one of the most popular open-source automation servers, plays a vital role in enabling Continuous Integration and Continuous Delivery (CI/CD). As projects grow in complexity, so does the need for flexibility within Jenkins pipelines and jobs. This is where parameters come into play.
Parameters in Jenkins allow users to create dynamic, flexible, and reusable build jobs. Instead of hardcoding values like environment names, version numbers, or feature flags, parameters let you input these values at build time, making your pipelines more adaptable and maintainable. They empower teams to use a single job for multiple use cases—whether that means deploying to different environments, testing various configurations, or selecting specific versions of code to build.
Imagine you’re deploying an application to development, staging, and production environments. Without parameters, you might need separate jobs for each environment, which leads to duplication and maintenance headaches. With parameters, you can configure a single job that accepts an environment name as input, streamlining the process and reducing clutter.
Jenkins supports multiple types of parameters, each suited for different kinds of inputs. These include string parameters for free text, choice parameters for dropdown selections, boolean parameters for true/false toggles, and even file and password parameters for more advanced use cases. Additionally, plugins like the Active Choices Plugin allow dynamic parameter behavior based on Groovy scripts or other parameters.
Using parameters is straightforward. In freestyle jobs, you can enable the “This project is parameterized” checkbox and add parameters directly from the UI. In pipeline jobs (using Jenkinsfiles), parameters are defined using the parameters block within the pipeline script. These values can then be referenced inside build stages to alter behavior based on user input.
This approach not only makes your Jenkins jobs more user-friendly but also aligns with best practices like DRY (Don’t Repeat Yourself) and infrastructure as code. Whether you’re triggering builds manually, through the Jenkins UI, or via automated API calls, parameters provide a powerful way to influence job behavior without altering the pipeline logic itself.
Moreover, parameters enhance collaboration and consistency across teams. Developers, QA engineers, and DevOps personnel can all interact with the same build job but tailor it to their needs through parameter inputs. This reduces miscommunication, speeds up workflows, and ensures that environments remain consistent across deployments.
In larger organizations, where compliance and traceability matter, parameters also offer better auditability. Each build triggered with parameters creates a recorded set of inputs, making it easy to trace what version was deployed, to which environment, and with what options.
In this blog post, we’ll dive deep into the different types of Jenkins parameters, how to configure them in both freestyle and pipeline jobs, and real-world use cases to demonstrate their value. You’ll also learn tips, tricks, and best practices to get the most out of Jenkins parameters in your CI/CD workflows.

Whether you’re a beginner looking to understand the basics or an experienced DevOps engineer seeking advanced techniques, understanding the parameter concept in Jenkins will significantly improve your automation game.
Step 1: Understand What Parameters Are
- Parameters allow you to define inputs that a user must or can provide before a build starts.
- Common use cases:
- Deploying to different environments (
dev,test,prod) - Choosing different branches or build versions
- Passing configuration settings
- Deploying to different environments (
Step 2: Enable Parameters for a Jenkins Job
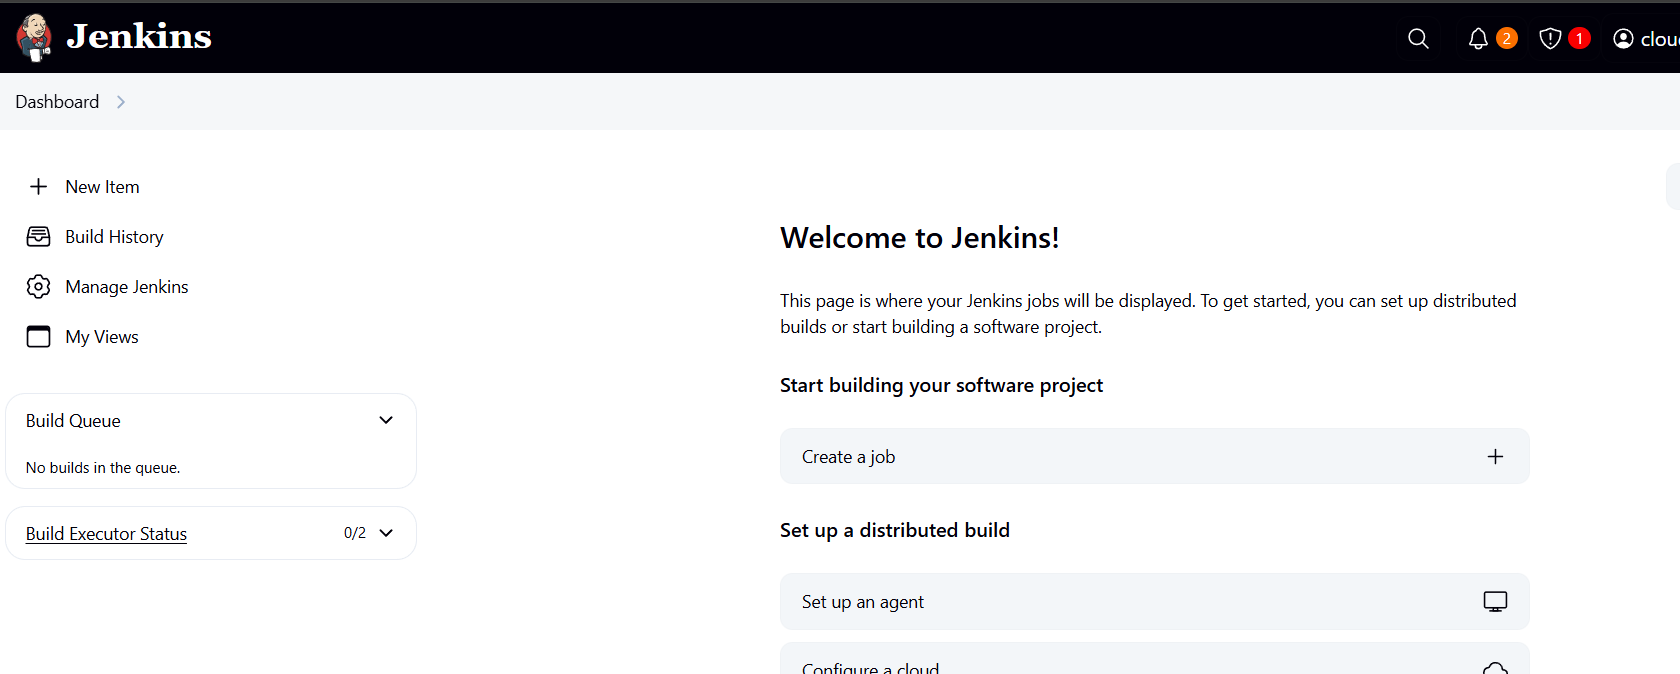
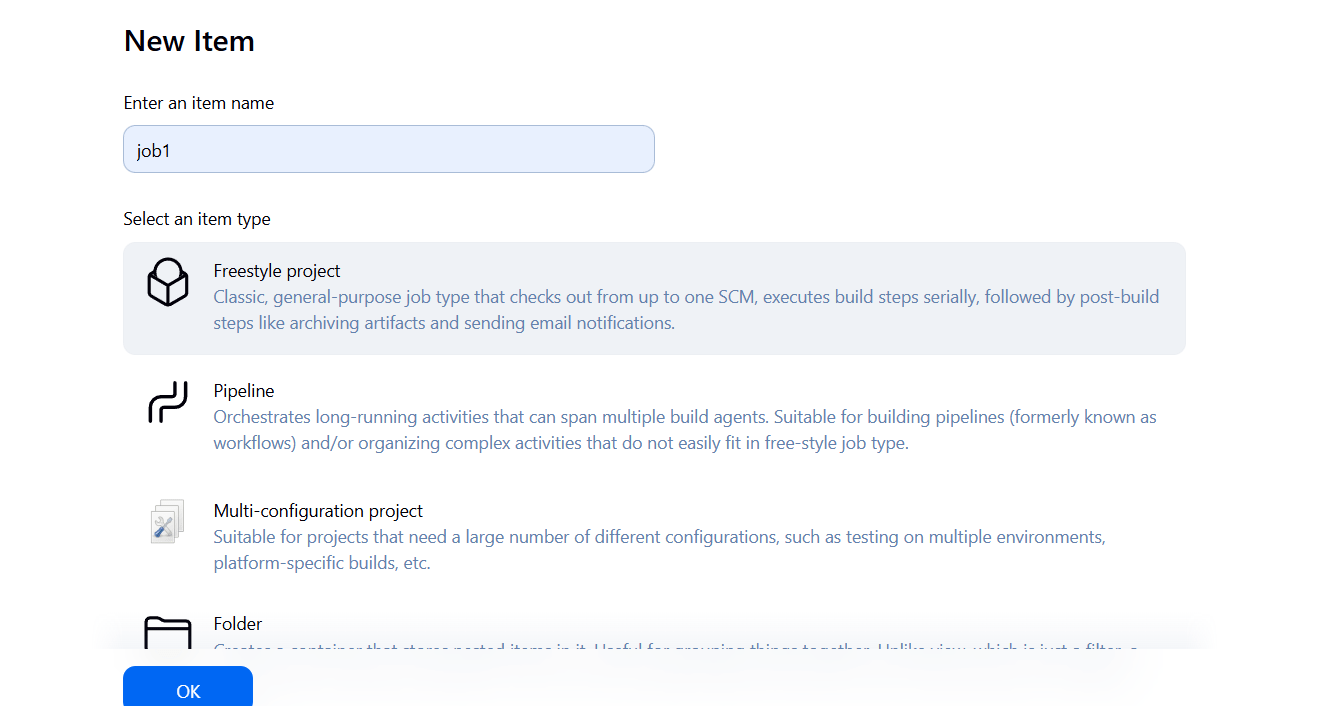
- Go to your Jenkins job (freestyle or pipeline).
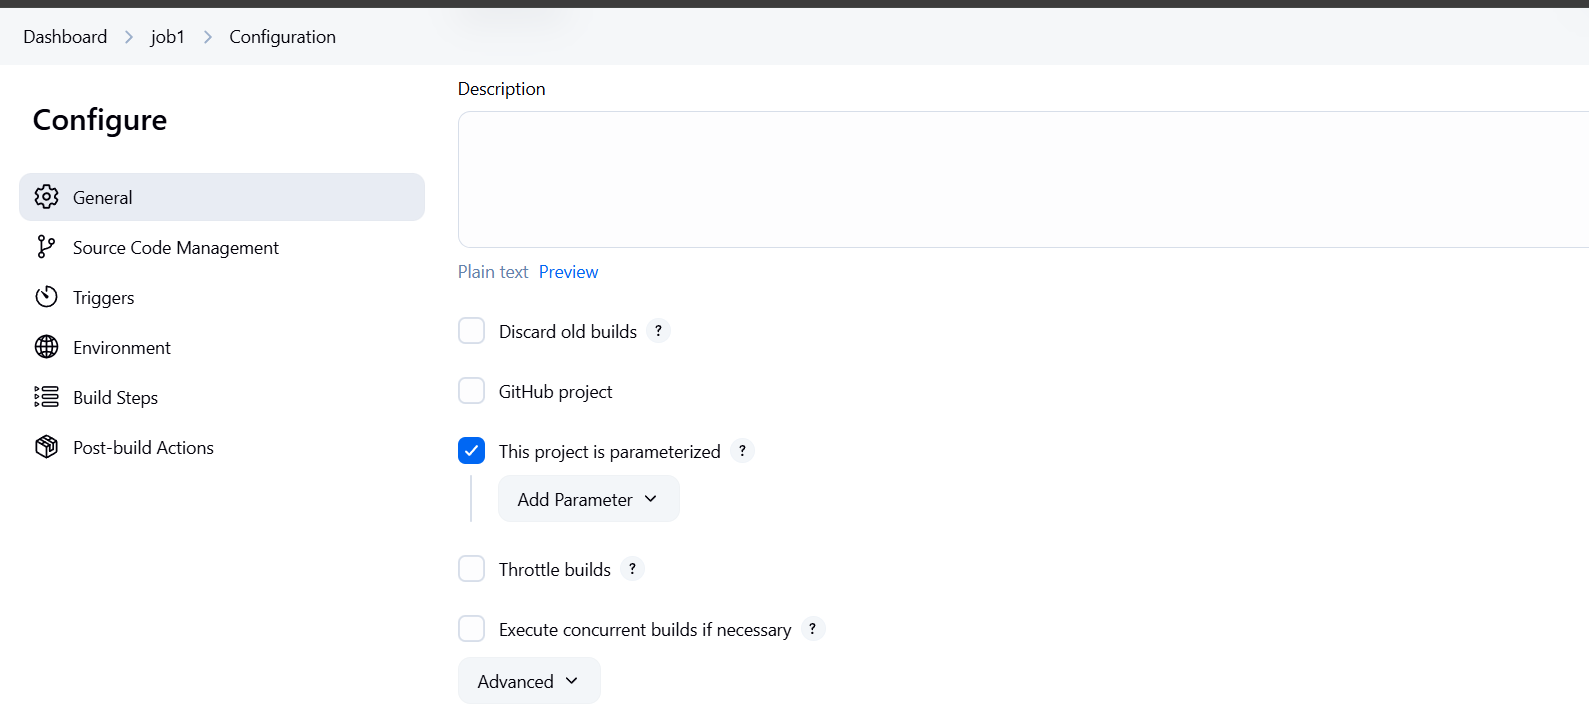
- Click “Configure”.
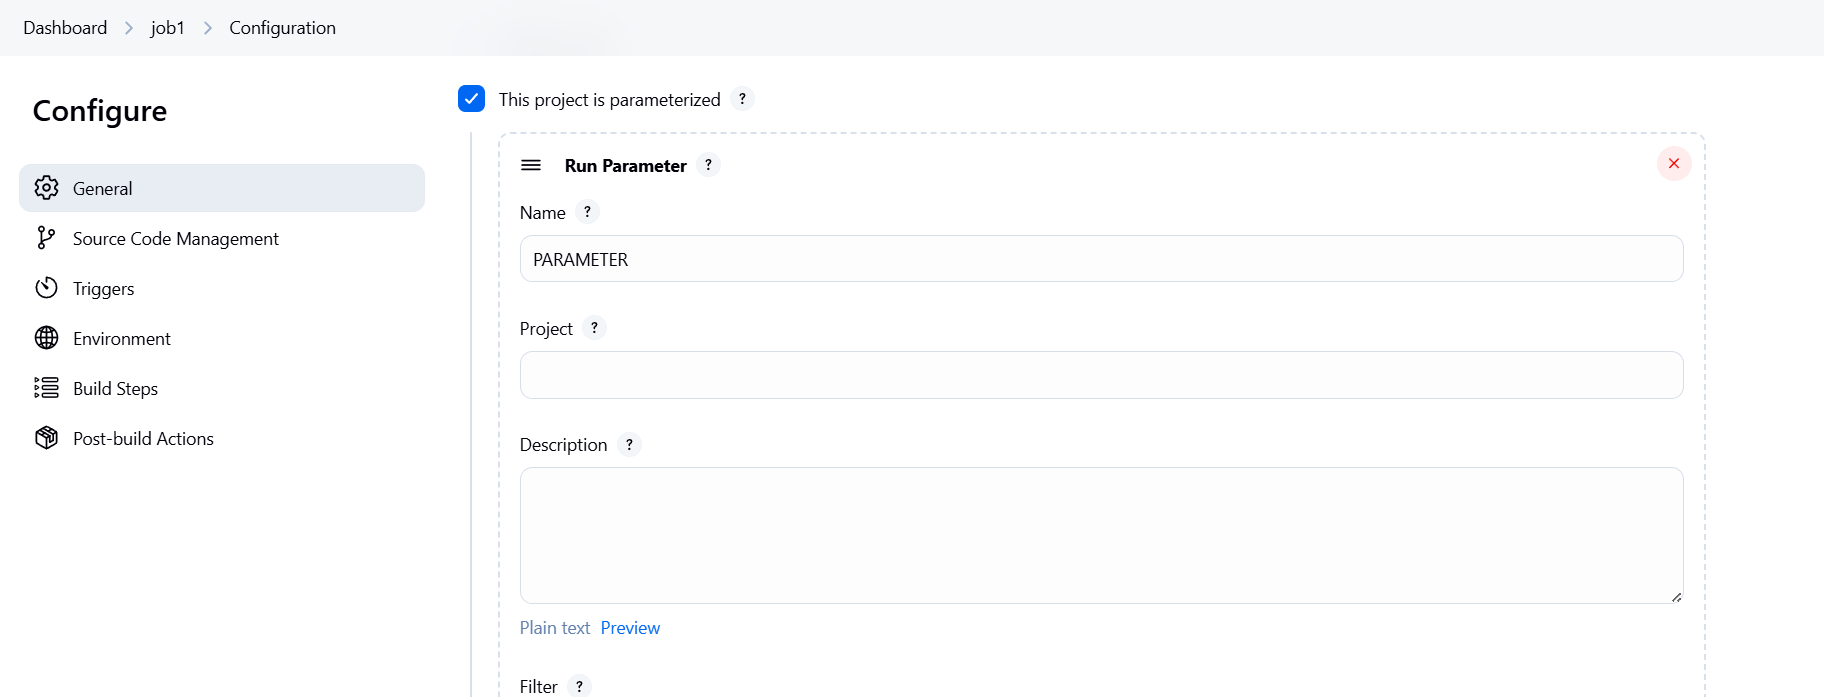
- Check the box “This project is parameterized”.
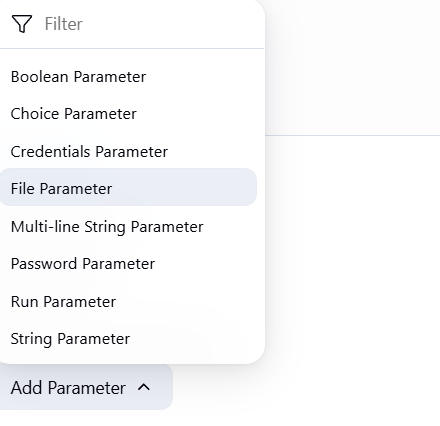
- Click “Add Parameter”.

Step 3: Types of Parameters
Jenkins offers several parameter types:
| Parameter Type | Description |
|---|---|
| String Parameter | User inputs a single line of text (e.g., version number). |
| Boolean Parameter | Checkbox; true/false toggle. |
| Choice Parameter | Dropdown with predefined values. |
| Password Parameter | Input hidden for sensitive values. |
| File Parameter | Allows uploading a file. |
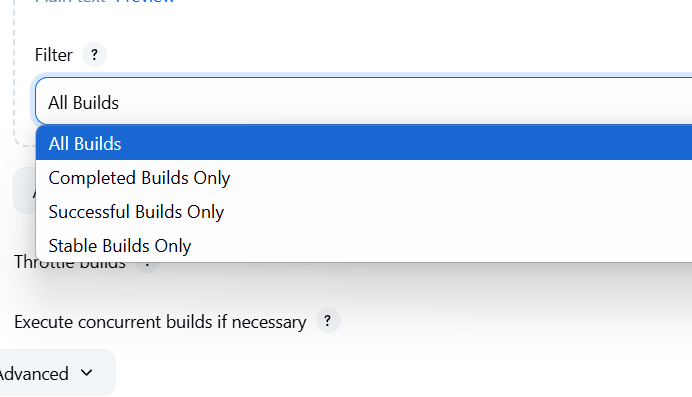
| Run Parameter | Selects a specific build of another job. |
| Active Choices Parameter (via plugin) | Dynamically populated options using Groovy scripts. |
Step 4: Using Parameters in Freestyle Job
After adding parameters:
- Use them in build steps (e.g., in shell scripts) using
${PARAMETER_NAME}. - Example:
echo "Deploying to environment: ${ENV}"Step 5: Using Parameters in Pipeline Job (Jenkinsfile)
Define parameters at the top of the pipeline script:
pipeline {
    agent any
    parameters {
        string(name: 'VERSION', defaultValue: '1.0', description: 'Version to deploy')
        booleanParam(name: 'DEPLOY', defaultValue: true, description: 'Deploy after build?')
        choice(name: 'ENV', choices: ['dev', 'test', 'prod'], description: 'Target environment')
    }
    stages {
        stage('Build') {
            steps {
                echo "Building version: ${params.VERSION}"
            }
        }
        stage('Deploy') {
            when {
                expression { return params.DEPLOY }
            }
            steps {
                echo "Deploying to: ${params.ENV}"
            }
        }
    }
}
Step 6: Triggering Builds with Parameters
You can:
- Click “Build with Parameters” in the UI.
- Trigger via API or CLI, passing parameter values.
Example API call:
curl -X POST http://jenkins/job/myjob/buildWithParameters \
  --user user:token \
  --data "VERSION=2.0&DEPLOY=true&ENV=prod"
Step 7: Tips and Best Practices
- Use descriptive names and helpful descriptions.
- Validate inputs using scripts or plugins like Extended Choice Parameter or Active Choices Plugin.
- Group related parameters together in the UI for usability.

Conclusion.
In today’s fast-paced development environment, automation isn’t just a convenience—it’s a necessity. Jenkins parameters offer a simple yet powerful way to make your build pipelines flexible, reusable, and intelligent. By using parameters, you reduce duplication, improve maintainability, and enable dynamic behavior across different stages of your CI/CD pipeline. Whether you’re deploying to multiple environments, testing specific branches, or handling user-driven configurations, parameters ensure that your Jenkins jobs adapt to the needs of the moment—without rewriting code or reconfiguring jobs every time.
From basic string and boolean inputs to dynamic values powered by plugins, the parameter system in Jenkins opens up a wide range of possibilities for customization and control. More importantly, it bridges the gap between technical efficiency and team collaboration, making it easier for developers, testers, and operations teams to work together through a unified and parameterized automation process.
As you integrate parameters into your Jenkins workflows, you not only streamline your builds but also embrace best practices that scale with your project. So, whether you’re building your first pipeline or refining an enterprise-grade deployment system, leveraging Jenkins parameters is a key step toward smarter, cleaner, and more efficient automation.
Step-by-Step: Using AWS Lambda to Process IoT Core Messages.
Introduction.
In today’s rapidly evolving digital world, the Internet of Things (IoT) has become a transformative force across industries—from smart homes and healthcare to agriculture and manufacturing. The increasing number of connected devices means an exponential rise in the volume of data generated at the edge. Processing this data efficiently, securely, and in real-time is critical for building responsive, intelligent, and automated systems. This is where AWS IoT Core, paired with AWS Lambda, offers a compelling solution. AWS IoT Core is a fully managed service that allows you to securely connect billions of devices and route their messages to AWS services. On the other hand, AWS Lambda is a serverless compute service that runs your code in response to events and automatically manages the compute resources, scaling as needed.
By combining these two services, developers can set up event-driven architectures where device messages are processed immediately as they arrive, without provisioning or managing any servers. When a device publishes data to AWS IoT Core—typically over the MQTT protocol—a rule in IoT Core can be configured to trigger a Lambda function. This function can process the incoming message, validate its contents, enrich it with additional context, transform the data format, filter or store it in services like DynamoDB or S3, send alerts, or even invoke further workflows in Step Functions or EventBridge. The possibilities are nearly endless.
One of the key advantages of this approach is serverless automation. Developers don’t have to worry about scaling their backend as more devices come online or message frequency increases. Lambda automatically handles horizontal scaling, and you’re only charged for the compute time used—making it a cost-efficient and operationally lightweight solution. Additionally, because AWS IoT Core supports fine-grained authentication and message-level encryption, you can ensure that your device data remains secure in transit and at rest.
Another powerful aspect of this integration is real-time responsiveness. In use cases such as industrial monitoring, predictive maintenance, or health tracking, it’s crucial to react to certain events immediately—like a temperature reading crossing a threshold or a device going offline. Lambda can process these messages instantly and trigger alerts, send notifications via SNS, or update dashboards, enabling real-time decision-making and automation.
This model also encourages modular, decoupled design. You can write individual Lambda functions to handle different types of messages or business logic, making your system more maintainable and scalable. It also integrates seamlessly with other AWS services such as Kinesis, S3, CloudWatch, and Athena, enabling advanced analytics and long-term data storage.
From a developer’s perspective, setting up this integration is straightforward. You define a rule in AWS IoT Core with an SQL-like syntax to filter messages or select specific topics. You then link that rule to a Lambda function, which you can develop using your preferred language (Node.js, Python, Java, etc.). AWS even provides test tools to simulate device behavior, making it easier to develop and debug your workflow before going live.
In summary, using AWS Lambda to handle AWS IoT messages is a modern, serverless approach to building scalable IoT applications. It eliminates the need for traditional servers, reduces latency, lowers operational costs, and increases development speed. Whether you’re working on a simple sensor data logger or a complex IoT platform, this combination empowers you to focus more on innovation and less on infrastructure. With built-in reliability, scalability, and deep AWS integration, it’s a solution well-suited for the next generation of connected systems. This guide will walk you through how to set up and use this powerful integration step by step.

Prerequisites
- AWS account
- IAM permissions to create IoT rules, Lambda functions, and IAM roles
- Basic knowledge of AWS services
Step 1: Create an AWS Lambda Function
- Go to the AWS Lambda Console: https://console.aws.amazon.com/lambda/
- Click Create function
- Choose:
- Author from scratch
- Function name: e.g.,
ProcessIoTMessage - Runtime: Python 3.x, Node.js, or your preferred language
- Choose or create a new IAM role with basic Lambda permissions
- Click Create function
- Add your processing code in the Lambda function (e.g., logging or storing data in DynamoDB)
# Example Python handler
def lambda_handler(event, context):
    print("Received event:", event)
    # Do something with the data, like saving to a DB
    return {
        'statusCode': 200,
        'body': 'Message processed'
    }
Step 2: Add Permissions for IoT to Invoke the Lambda
- Open your Lambda function
- Go to the Configuration tab → Permissions
- Under Execution role, click the role name to open it in IAM
- Add this permission policy to allow AWS IoT to invoke your function:
{
  "Effect": "Allow",
  "Action": "lambda:InvokeFunction",
  "Resource": "arn:aws:lambda:REGION:ACCOUNT_ID:function:ProcessIoTMessage"
}
Step 3: Create an AWS IoT Rule
- Go to the AWS IoT Core Console
- Click Act in the sidebar, then Create a rule
- Fill in:
- Name: e.g.,
InvokeLambdaOnMessage - SQL version: Latest
- Rule query statement:
- Name: e.g.,
SELECT * FROM 'iot/topic/path'- Replace
'iot/topic/path'with your device topic - Under Set one or more actions, choose Add action
- Select Invoke Lambda function
- Choose the Lambda you created (e.g.,
ProcessIoTMessage) - Click Create
Step 4: Test the Integration
- Use the MQTT test client in AWS IoT Core:
- Go to Test in the IoT console
- Publish a message to your topic:
{
  "temperature": 22.5,
  "deviceId": "sensor-01"
}- Check CloudWatch Logs for your Lambda function to verify it received the message.

Conclusion.
In conclusion, integrating AWS IoT Core with AWS Lambda offers a robust, scalable, and serverless solution for processing IoT messages in real time. This powerful combination enables developers to react instantly to incoming device data, automate workflows, and build responsive applications without the burden of managing infrastructure. Whether you’re building a small prototype or a production-scale IoT system, using Lambda to handle IoT messages simplifies development, enhances flexibility, and ensures high availability. With the ability to seamlessly connect to other AWS services, this architecture provides a strong foundation for modern IoT solutions—making it easier to turn raw device data into meaningful insights and actions.
Installing SonarQube: The Complete Beginner’s Guide.
Introduction.
In the modern software development landscape, ensuring code quality and maintaining clean, efficient, and secure code is paramount. Developers, teams, and organizations often find themselves managing vast amounts of code that can quickly become difficult to monitor and maintain. That’s where SonarQube comes in. SonarQube is an open-source platform for continuous inspection of code quality. It helps you detect issues, vulnerabilities, code smells, and even provides suggestions for improvement. It supports multiple programming languages, including Java, C#, Python, JavaScript, and many more, making it a versatile tool for teams working across various tech stacks. Whether you are a single developer or part of a large enterprise team, SonarQube offers actionable insights into your codebase to improve maintainability, security, and performance.
Installing and setting up SonarQube might seem like a complex task, especially for those who are new to continuous integration or static code analysis. However, SonarQube is designed to be straightforward to install and configure, whether you’re deploying it on a local machine, a server, or in the cloud. By integrating SonarQube into your development process, you can automate the review of your code and catch issues early before they become more difficult and costly to fix. In this blog, we will walk you through a simple, step-by-step process for installing SonarQube on a Linux system, focusing on Ubuntu. We’ll also touch on other deployment scenarios, like setting up SonarQube in a Docker container, to provide you with flexibility in how you choose to run it.
First, we’ll begin with the basic prerequisites for installing SonarQube, which include Java, a supported database like PostgreSQL, and an understanding of the environment in which SonarQube will run. Once that’s set up, we’ll guide you through downloading SonarQube, configuring it, and running it as a background service. Whether you’re looking to deploy SonarQube for individual use or integrate it with a CI/CD pipeline, we’ll cover all the necessary details to ensure smooth installation and operation.
In addition to the technical steps, we’ll also explore the benefits of integrating SonarQube into your development workflow. From the prevention of bugs to enforcing best coding practices and improving collaboration among team members, SonarQube provides powerful tools for ensuring that the quality of your software remains high throughout its lifecycle. As part of its reporting features, SonarQube offers an intuitive web interface that visualizes code metrics and issues, making it easy for developers to track progress and prioritize work. Moreover, SonarQube supports integrations with major tools like GitHub, GitLab, Jenkins, and Bitbucket, enhancing its functionality within your DevOps pipeline.
SonarQube also makes it easier for teams to adopt a continuous code quality culture, which is essential as software complexity increases. By using SonarQube’s detailed reports and dashboards, development teams can ensure that they are adhering to best practices such as secure coding, test coverage, and complexity management. Furthermore, SonarQube’s ability to detect vulnerabilities and code smells can be especially beneficial in highly regulated industries like finance, healthcare, and government.

In the following sections, we’ll guide you step-by-step through the installation process, so you can get your SonarQube instance up and running quickly. Whether you’re looking to set up SonarQube in a production environment or use it locally for personal projects, this guide will help you confidently deploy and configure SonarQube for your needs. By the end, you’ll be ready to start using SonarQube to monitor, improve, and maintain the quality of your codebase, ultimately ensuring that your software is robust, secure, and scalable.
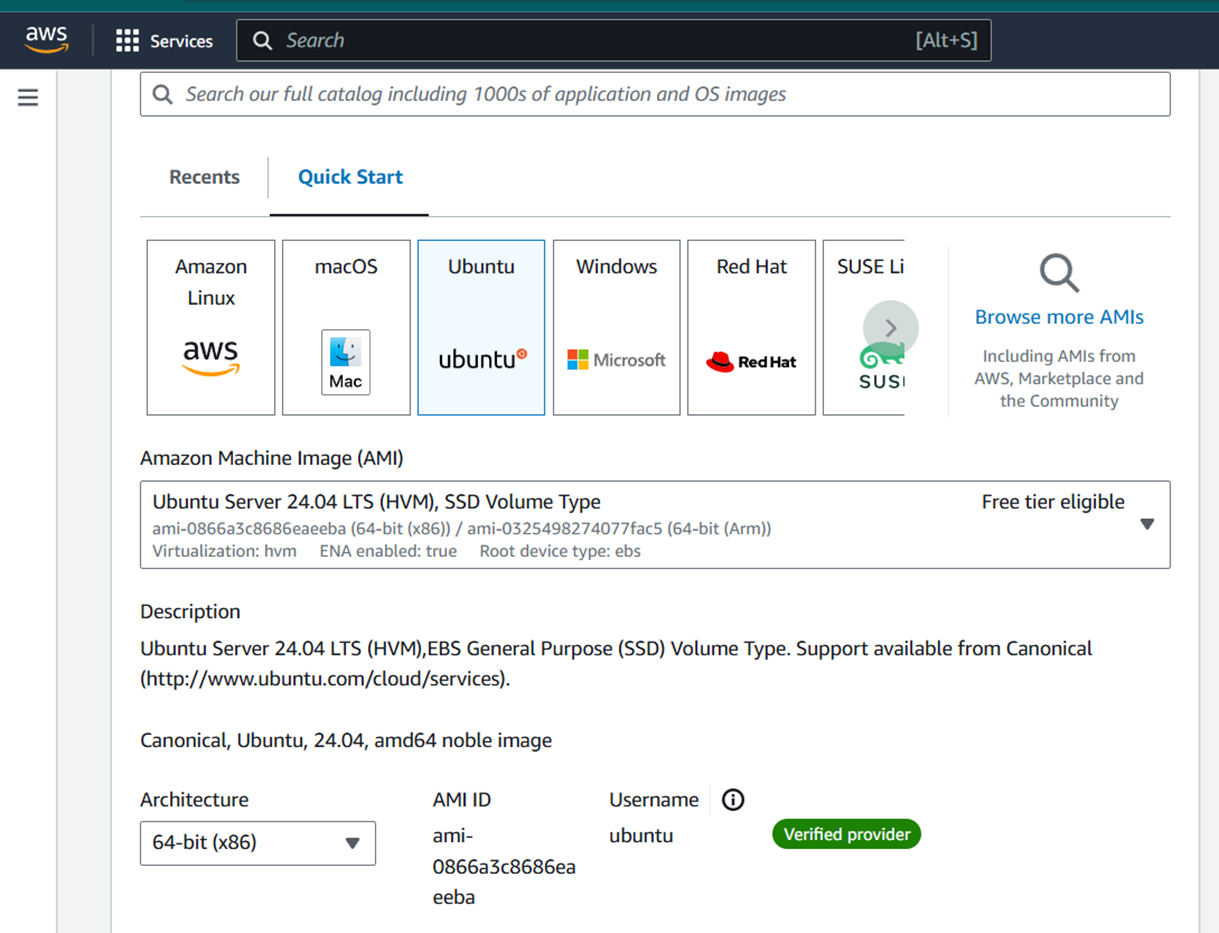
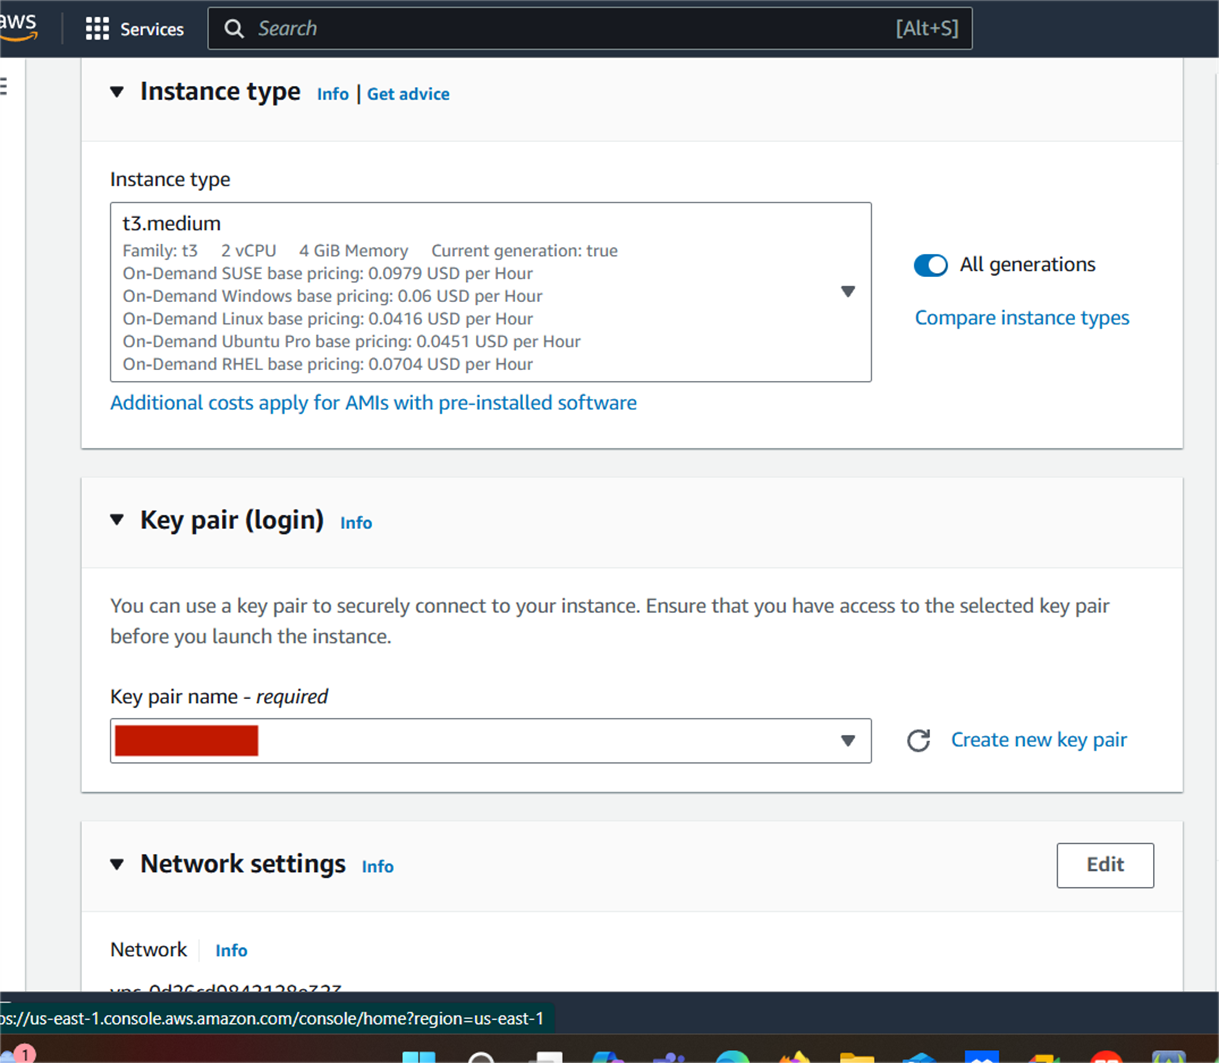
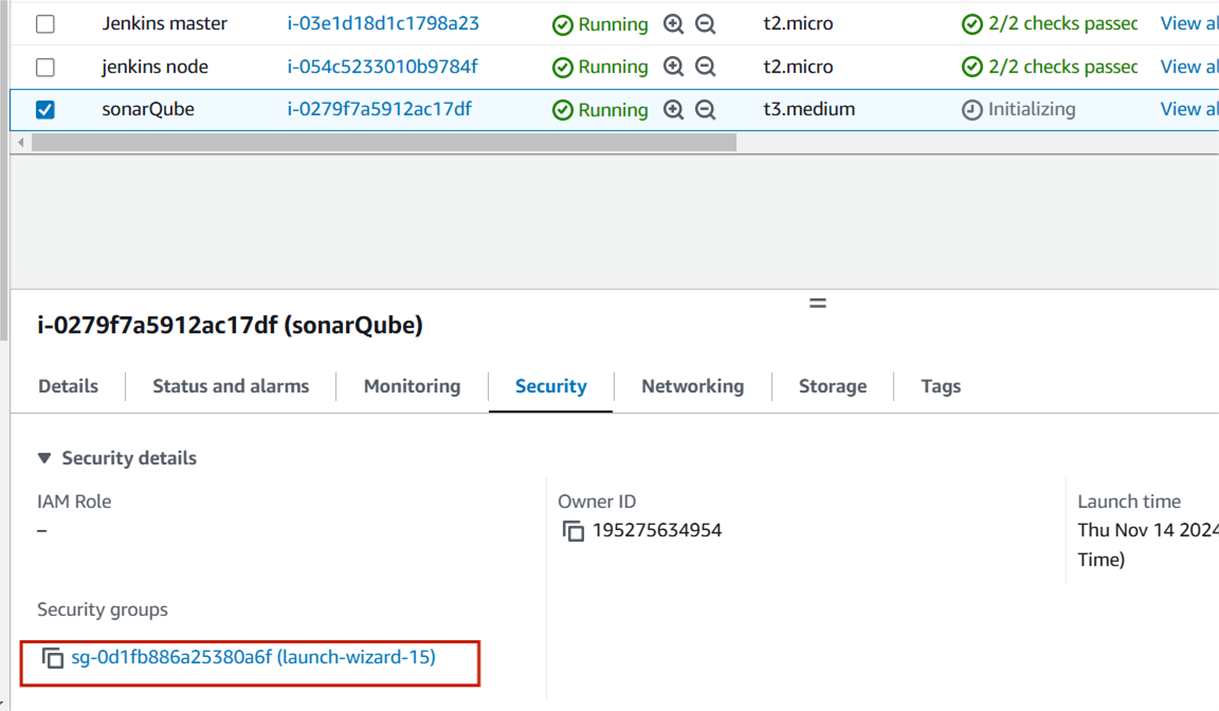
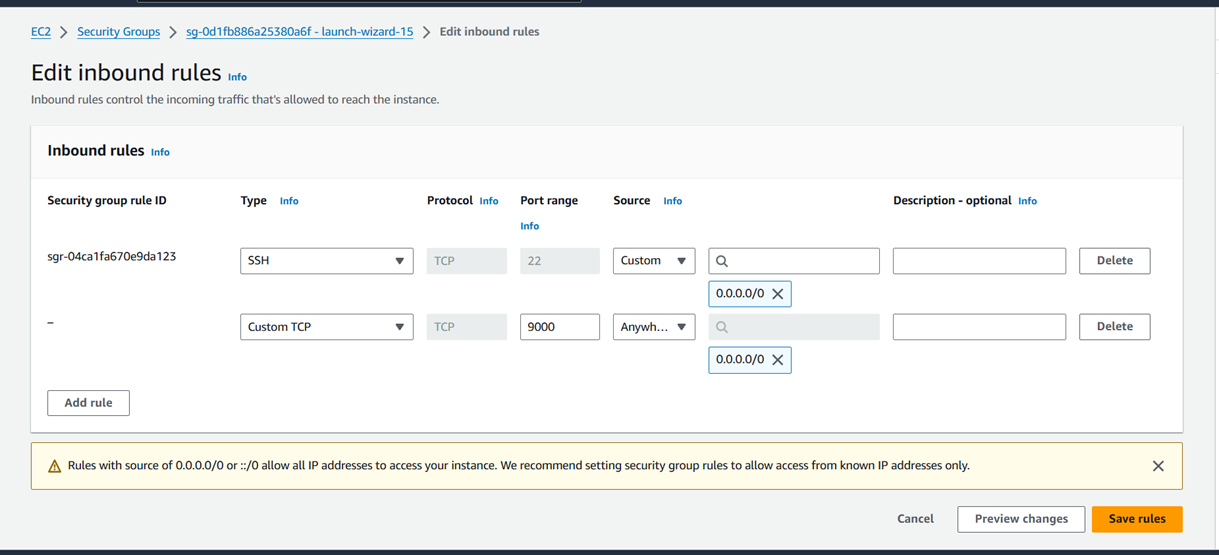
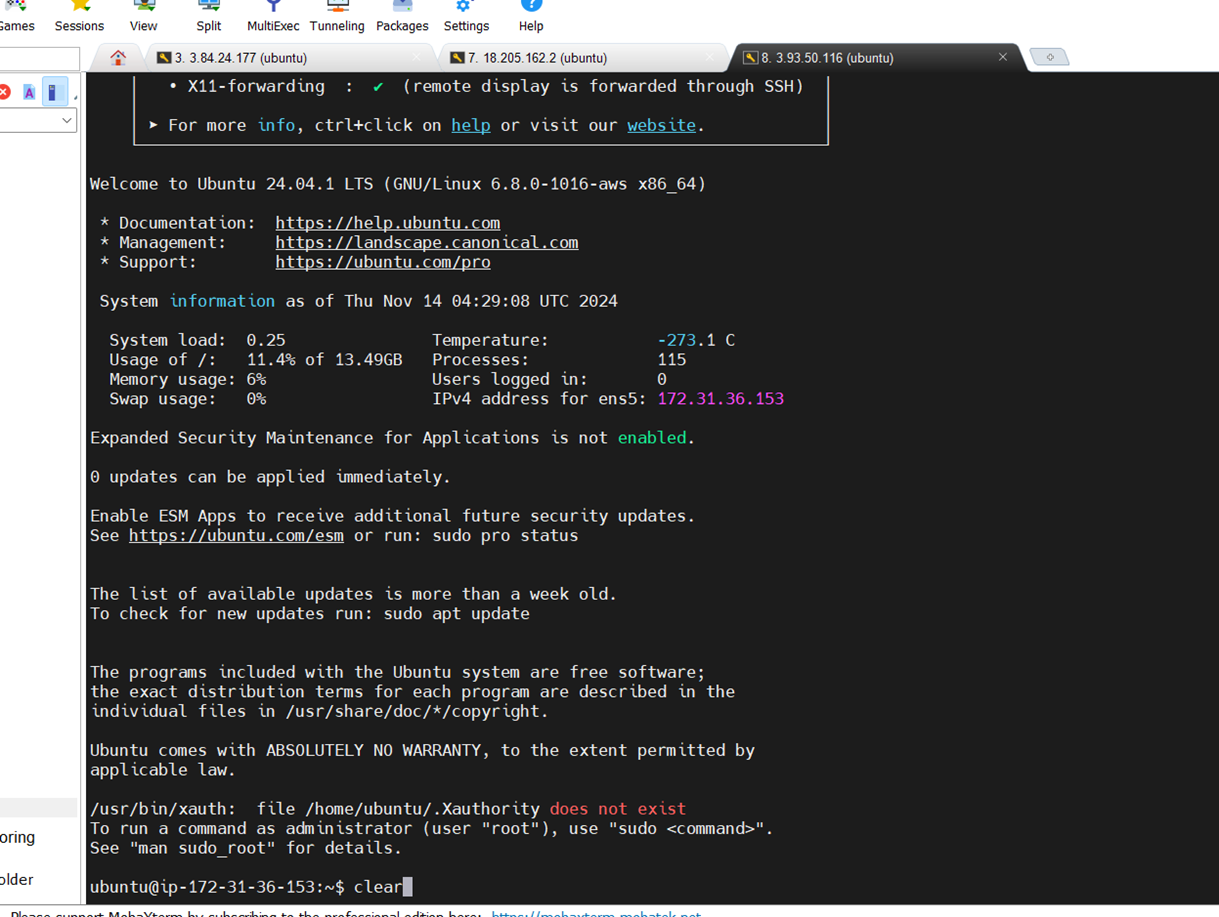
Prerequisites
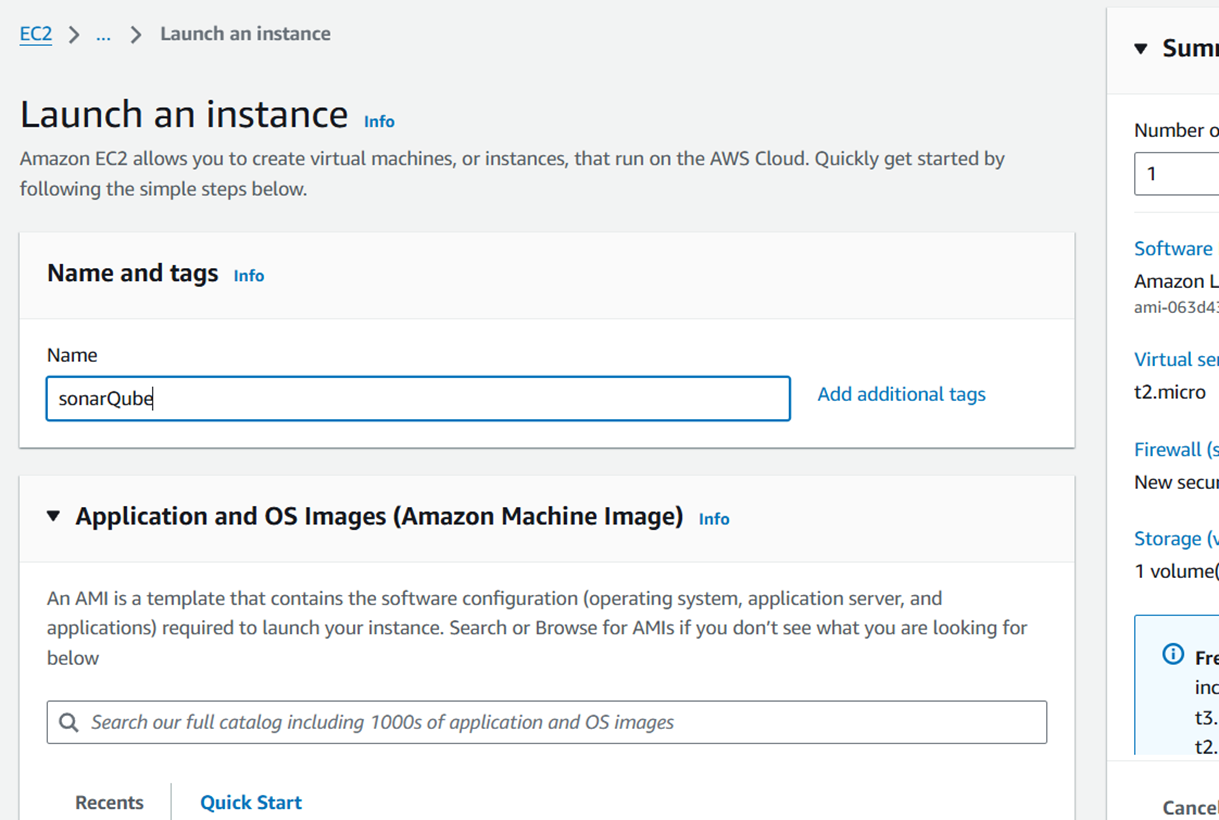
- OS: Ubuntu 20.04+ (or equivalent)
- Java: Java 17 (SonarQube 9.x+ requires Java 17)
- Database: PostgreSQL 12+
- User access: Non-root user with
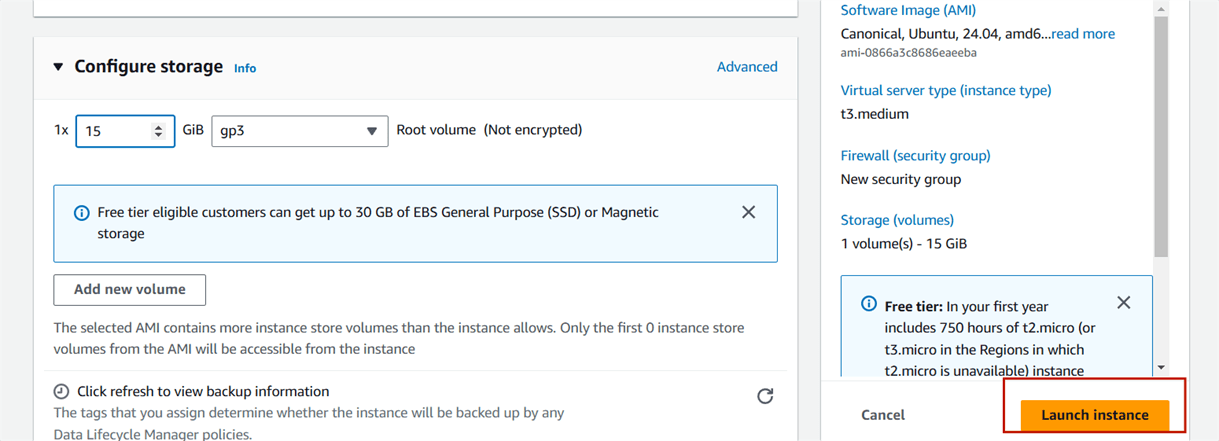
sudoprivileges - At least 2GB RAM (recommended 4GB+)
Step 1: Install Java 17
sudo apt update
sudo apt install openjdk-17-jdk -y
java -version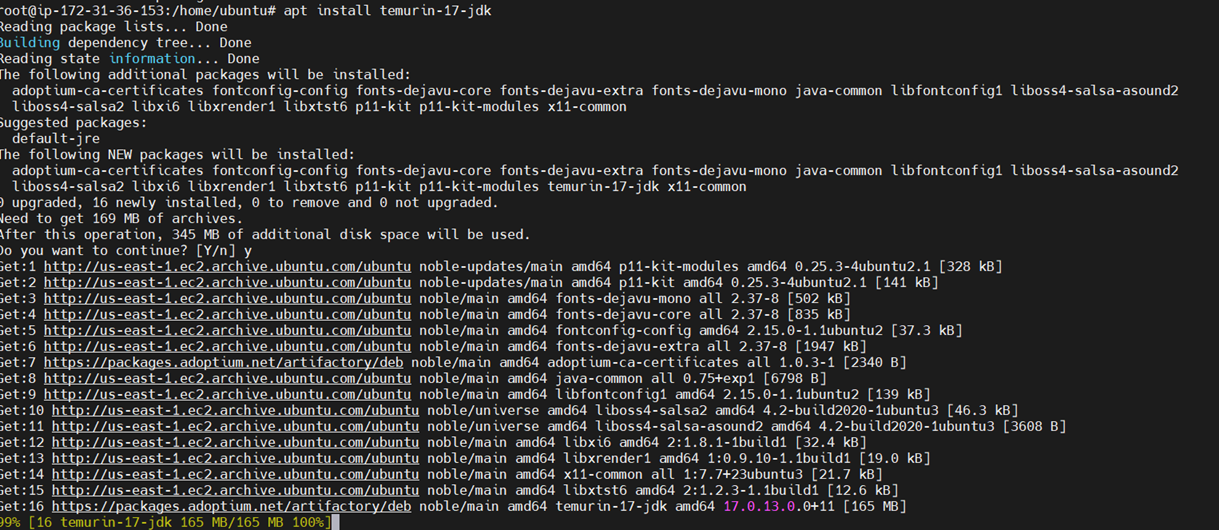
Step 2: Install and Configure PostgreSQL
sudo apt install postgresql postgresql-contrib -y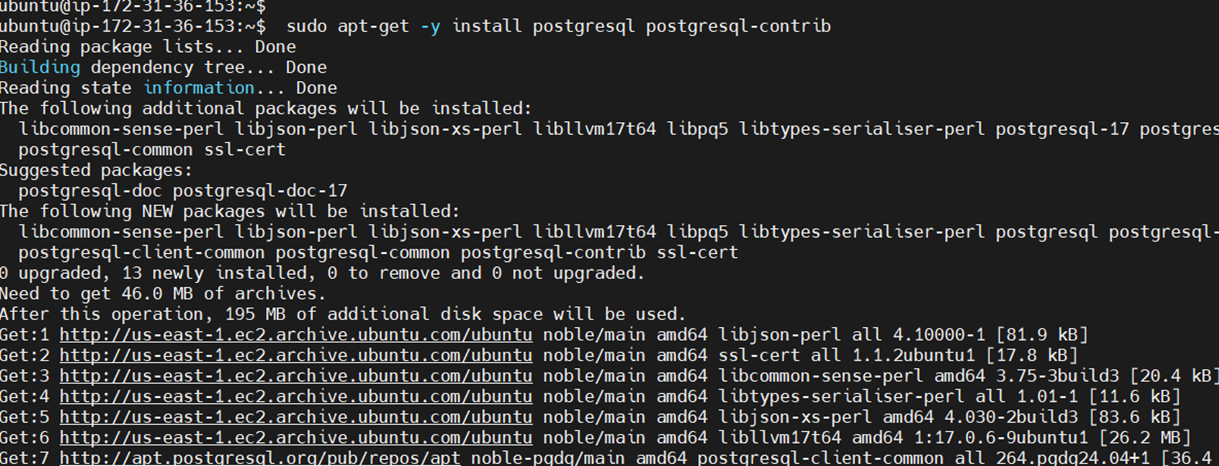
Create a new user and database:
sudo -u postgres psqlInside the PostgreSQL shell:
CREATE USER sonar WITH ENCRYPTED PASSWORD 'your_secure_password';
CREATE DATABASE sonarqube OWNER sonar;
\q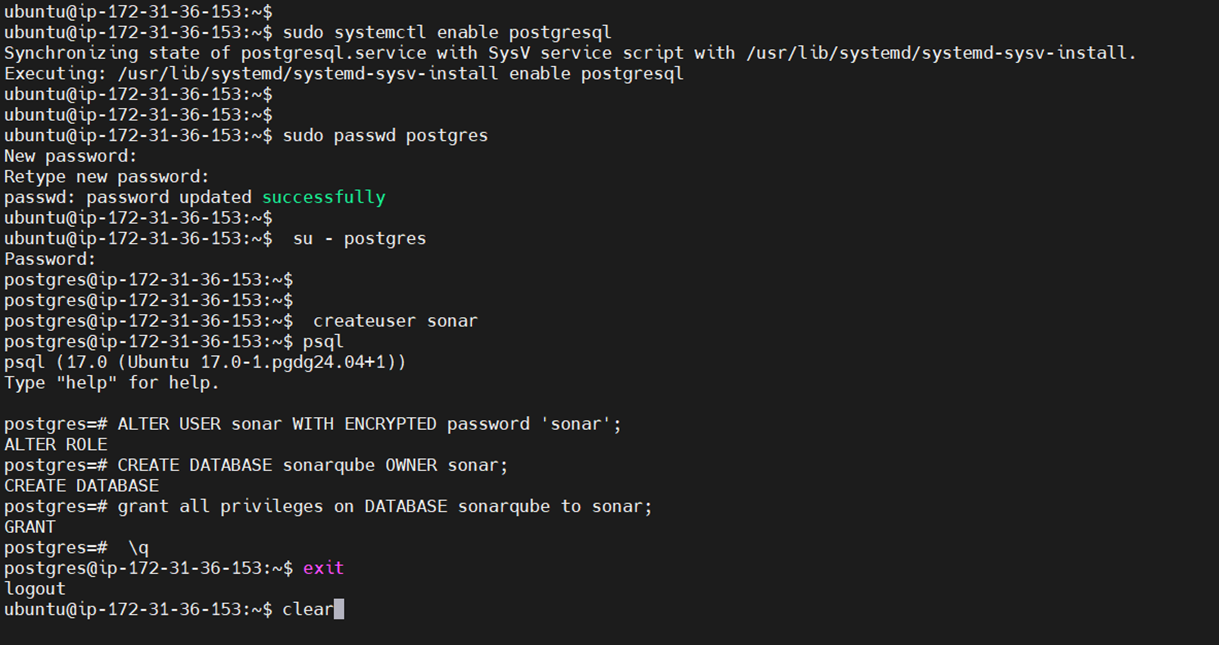
Step 3: Download and Install SonarQube.
cd /opt
sudo wget https://binaries.sonarsource.com/Distribution/sonarqube/sonarqube-9.9.3.79811.zip
sudo apt install unzip -y
sudo unzip sonarqube-9.9.3.79811.zip
sudo mv sonarqube-9.9.3.79811 sonarqube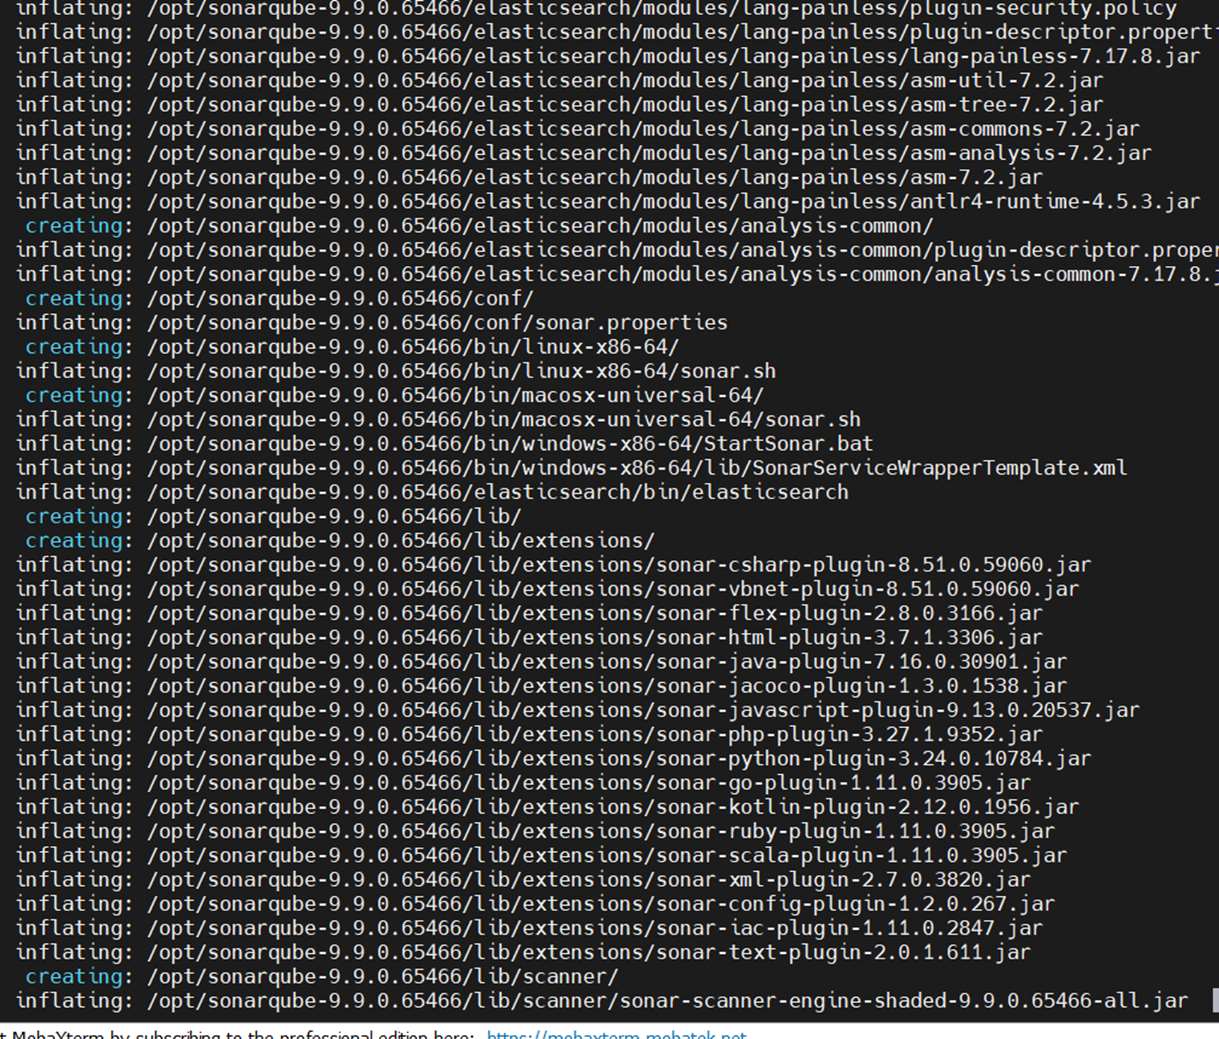
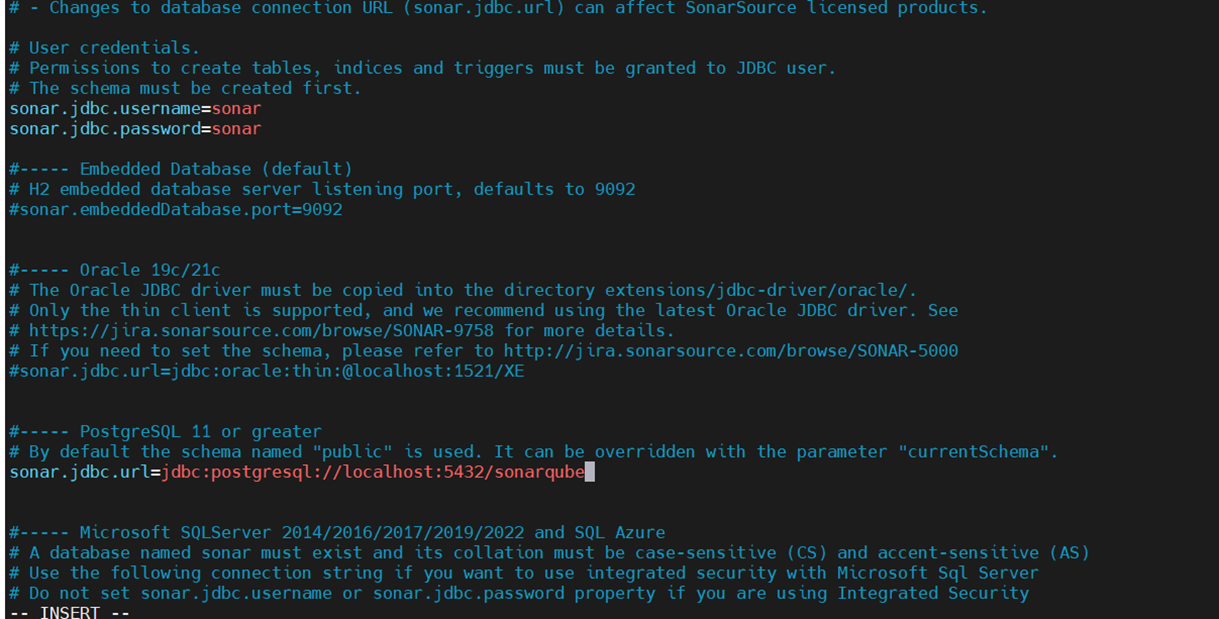
Step 4: Configure SonarQube.
Edit the configuration file:
sudo nano /opt/sonarqube/conf/sonar.propertiesSet the database credentials:
sonar.jdbc.username=sonar
sonar.jdbc.password=your_secure_password
sonar.jdbc.url=jdbc:postgresql://localhost/sonarqube
Step 5: Create a SonarQube User.
sudo adduser --system --no-create-home --group --disabled-login sonarqube
sudo chown -R sonarqube:sonarqube /opt/sonarqube
Step 6: Set Up a Systemd Service.
Create the service file:
sudo nano /etc/systemd/system/sonarqube.servicePaste this:
[Unit]
Description=SonarQube service
After=syslog.target network.target

[Service]
Type=forking

ExecStart=/opt/sonarqube/bin/linux-x86-64/sonar.sh start
ExecStop=/opt/sonarqube/bin/linux-x86-64/sonar.sh stop

User=sonarqube
Group=sonarqube
Restart=always

[Install]
WantedBy=multi-user.target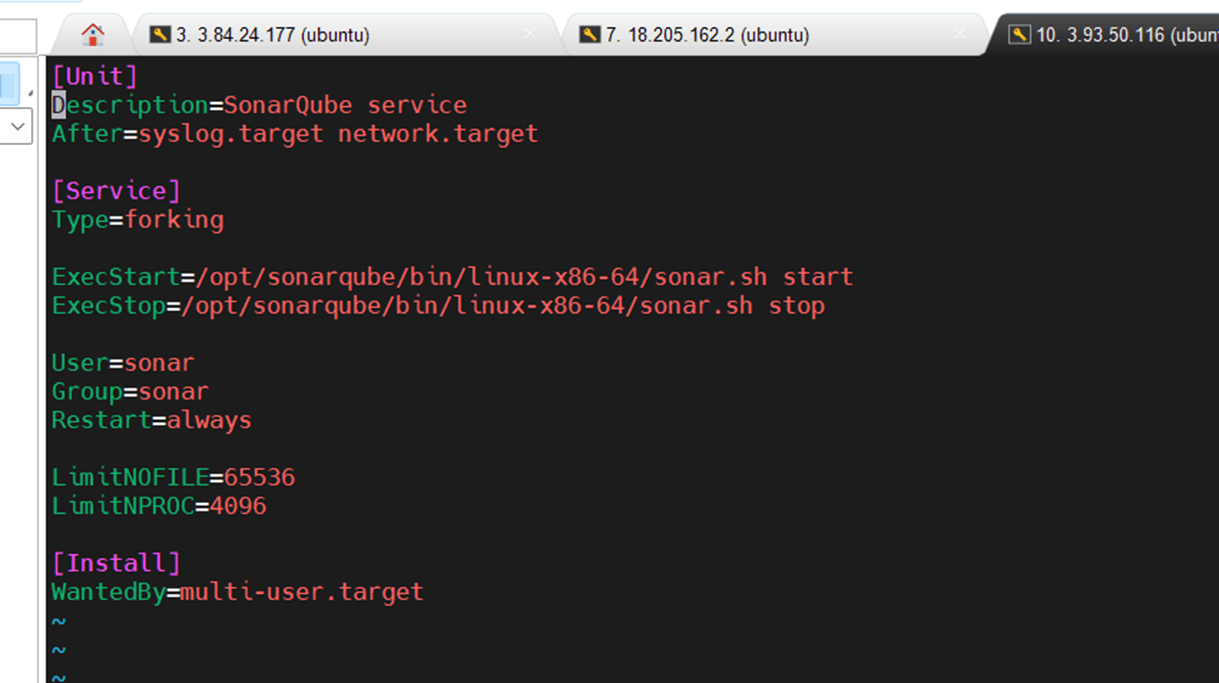
Enable and start the service.
sudo systemctl daemon-reexec
sudo systemctl enable sonarqube
sudo systemctl start sonarqube
Check if it’s running:
sudo systemctl status sonarqube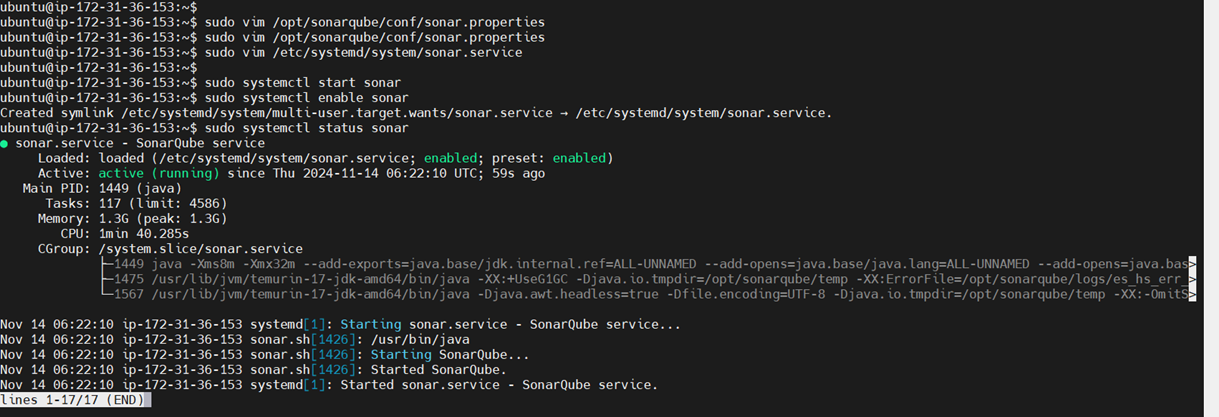
Step 7: Access SonarQube
Open your browser and go to:
http://your-server-ip:9000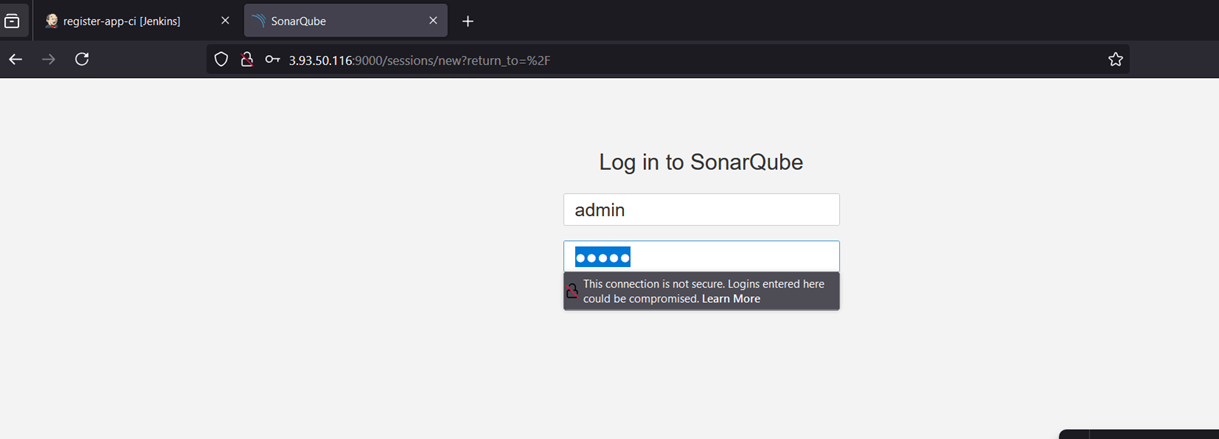
Default login:
- Username: admin
- Password: admin
You’ll be prompted to change the password on first login.

Conclusion.
In conclusion, SonarQube is an invaluable tool for developers and teams looking to maintain high standards of code quality throughout the development lifecycle. By following the simple steps outlined in this guide, you can quickly set up SonarQube and begin taking advantage of its powerful features, including real-time code analysis, vulnerability detection, and performance optimization. Whether you’re a solo developer aiming to improve your codebase or part of a larger team seeking continuous integration and delivery, SonarQube is flexible enough to meet a wide range of use cases.
The installation process, while initially requiring a few key components like Java, PostgreSQL, and SonarQube itself, is straightforward and can be adapted to various environments such as local machines, servers, or even Docker containers. Once up and running, SonarQube integrates seamlessly into your existing workflow, allowing you to catch potential issues early, prioritize technical debt, and align with best practices across different programming languages and frameworks.
Beyond its ease of use, SonarQube is an excellent tool for fostering a culture of continuous improvement. It provides transparency into your code’s health, making it easier to identify and resolve problems proactively. The SonarQube dashboard offers an intuitive, visual representation of key metrics, helping teams stay focused on maintaining high-quality standards across the board. As a result, not only does SonarQube boost the quality of your software, but it also enhances collaboration, accelerates development cycles, and reduces the risk of bugs or vulnerabilities reaching production.
Whether you deploy SonarQube on your own infrastructure, integrate it into a cloud-based environment, or run it in a Docker container, the benefits are clear. By embracing SonarQube, you’re making an investment in the long-term success of your projects—ensuring your code is cleaner, more secure, and easier to maintain.
If you’ve followed this guide and completed your SonarQube installation, you’re now ready to start using it to analyze your code and improve its quality. Happy coding, and may your development journey be cleaner and more efficient with SonarQube at your side!


