Introduction.
In today’s cloud-native world, monitoring and observability are crucial for ensuring the health and performance of applications, systems, and services. As organizations increasingly adopt microservices and containerized environments, the need for efficient, scalable, and flexible monitoring solutions has grown. Amazon Managed Service for Prometheus is one such powerful solution that allows organizations to collect, store, and query high-resolution metrics at scale.
AWS Prometheus is a fully managed service that simplifies the setup and management of Prometheus, an open-source system monitoring and alerting toolkit designed specifically for modern, containerized applications. Prometheus is widely adopted in the tech community for its robust support of time-series data, flexible querying capabilities, and seamless integration with Kubernetes and other container orchestration systems.
By using AWS Managed Prometheus, organizations can benefit from a fully managed, scalable, and secure platform for monitoring metrics without the overhead of managing the infrastructure required for self-hosting Prometheus. AWS handles much of the operational complexity, including scaling the system as your workloads grow, managing backups, and applying necessary security patches, allowing teams to focus on monitoring and alerting rather than infrastructure management.
A major advantage of using AWS Prometheus is its integration with Amazon CloudWatch and other AWS services. This provides a holistic monitoring solution, where AWS Prometheus collects and stores your metrics data, while Amazon CloudWatch can handle logs and dashboards. This integration enables users to correlate metrics, logs, and traces for a complete view of system health and performance.
Setting up AWS Prometheus is straightforward and efficient. Through the AWS Management Console or via AWS CLI, you can quickly create a Prometheus workspace, configure data collection, and start storing time-series metrics. With Prometheus’ native support for PromQL (Prometheus Query Language), users can query their data in a powerful and flexible way, making it easy to gain insights into application performance, resource utilization, and more.
This guide will walk you through the process of creating and configuring AWS Prometheus, starting from setting up the workspace to integrating it with your existing monitoring stack. Whether you’re monitoring Kubernetes clusters, EC2 instances, or containerized workloads, AWS Prometheus provides the scalability and reliability needed for comprehensive monitoring and observability.
Moreover, you’ll learn how to configure data scraping, set up alerting for critical thresholds, and leverage AWS’s security features to ensure that your monitoring data is protected. We will also explore how AWS Prometheus can help your organization improve the efficiency and reliability of applications, giving you the insights needed to optimize performance and quickly identify and address issues.
By the end of this guide, you will be ready to set up AWS Prometheus and start monitoring your cloud-native applications with confidence. Whether you are a DevOps engineer, cloud architect, or systems administrator, AWS Prometheus provides the tools needed for proactive monitoring, performance optimization, and enhanced observability in a dynamic cloud environment.

Step 1: Sign in to AWS Management Console
- Go to the AWS Management Console.
- Log in to your AWS account using your credentials.
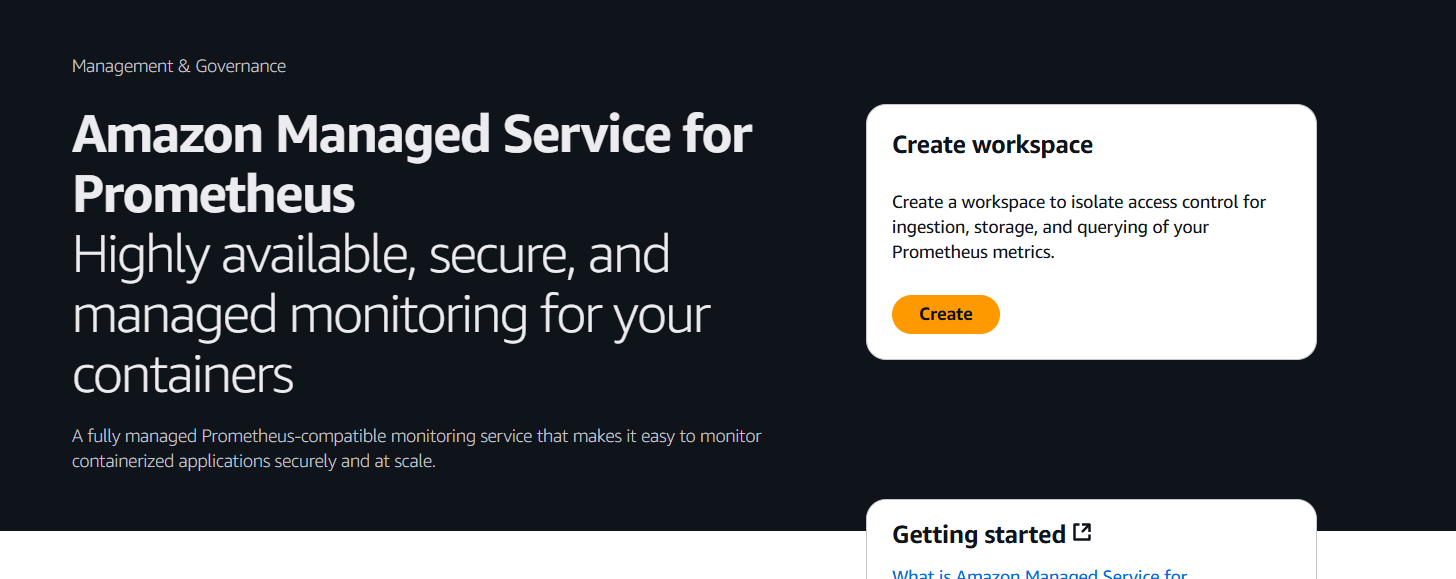
Step 2: Open Amazon Managed Service for Prometheus
- In the AWS Management Console, search for Prometheus in the search bar or navigate to Amazon Managed Service for Prometheus (AMP).
- Click on Amazon Managed Service for Prometheus to open the service dashboard.
Step 3: Create a New Prometheus Workspace
- On the Amazon Managed Service for Prometheus (AMP) dashboard, click on Create workspace.
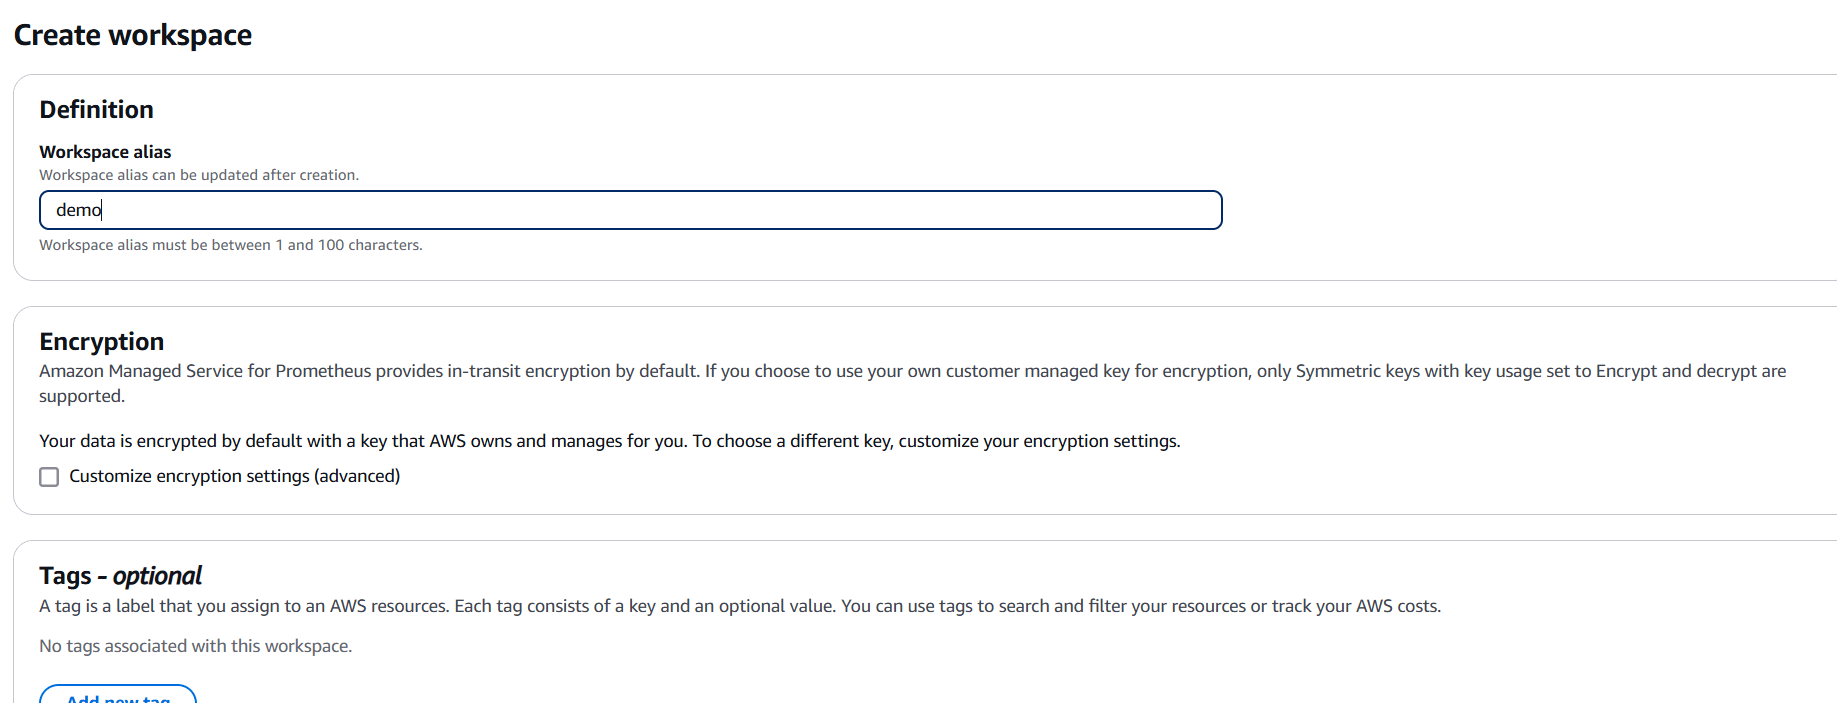
- Workspace Name:
- Enter a name for your workspace. This name will be used to identify your workspace in the console. It could be something like
MyPrometheusWorkspaceor something related to your application or project.
- Enter a name for your workspace. This name will be used to identify your workspace in the console. It could be something like
- Workspace Configuration:
- For now, you don’t need to worry about advanced configurations. You can leave the default settings for now. These defaults are fine for getting started, but you can customize them later based on your needs.
Step 4: Configure Permissions (IAM Role)
- Set up permissions: To allow AWS Prometheus to access the metrics data, you need to define permissions for the workspace.
- IAM Role: If you don’t have an IAM role for AMP, you can create one directly through the console. The role must have the necessary permissions to interact with Prometheus.
- AWS Prometheus uses Amazon Prometheus Access Roles that allow you to manage access to your data.
Step 5: Review and Create Workspace
- Review the settings: Review all the details you’ve entered for your workspace, including the name and IAM role.
- Create the workspace: Once you’re satisfied with the configuration, click on the Create workspace button.
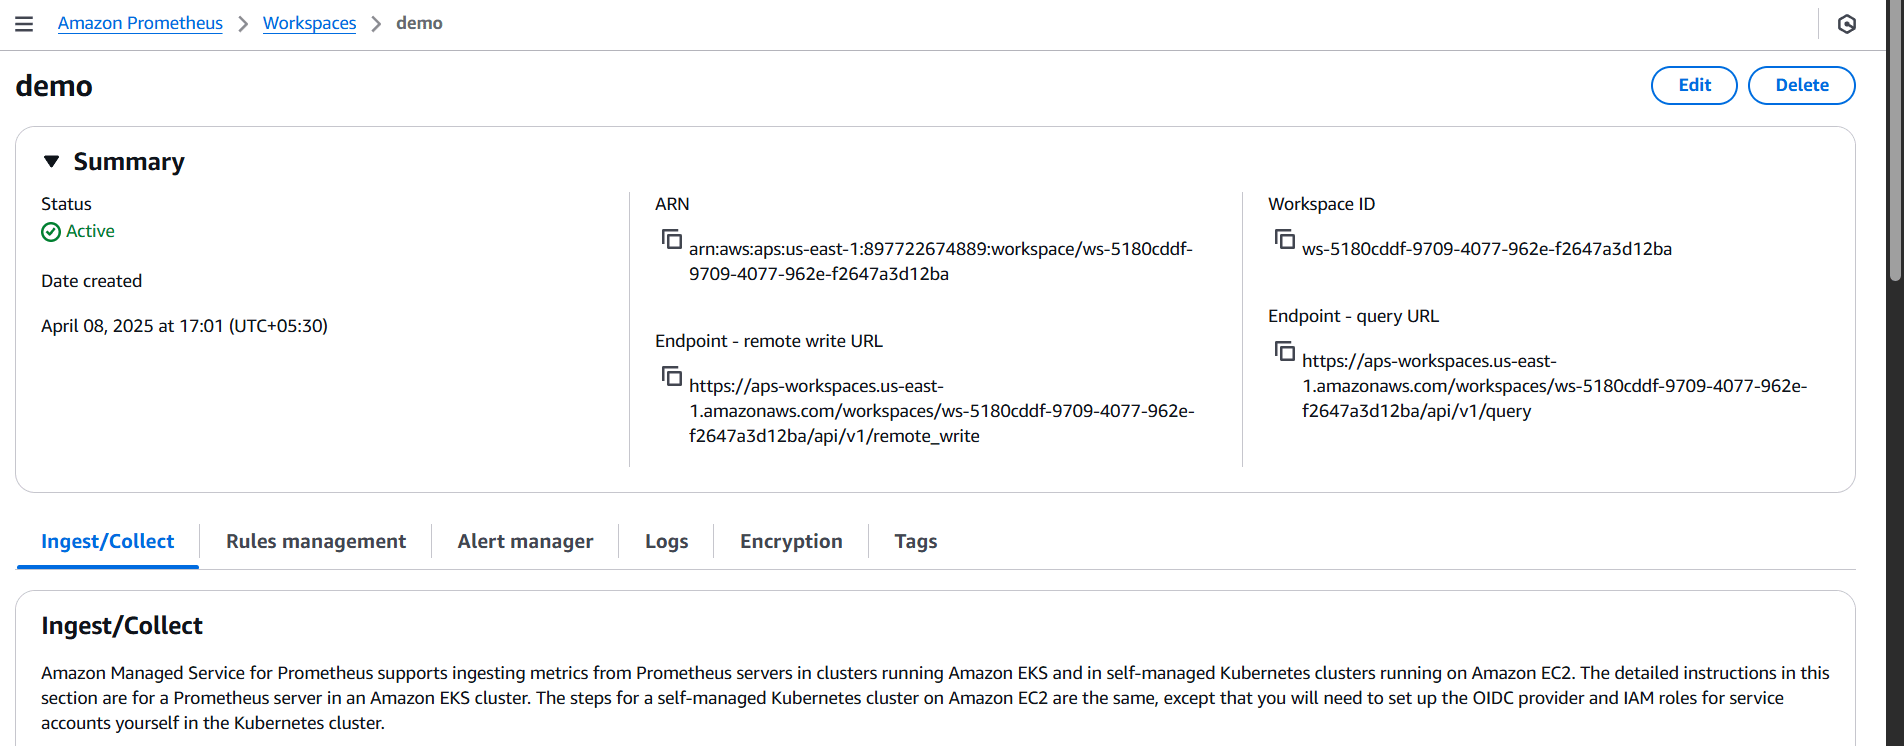
Step 6: Workspace Creation Complete
- Once the workspace is created, you’ll be directed to a confirmation page where you can see the Workspace name and status.
- The status of the workspace will change to Active once it’s fully provisioned.


Conclusion.
In conclusion, AWS Managed Prometheus is a powerful and scalable solution for organizations looking to effectively monitor their cloud-native applications and infrastructure. By leveraging the capabilities of Prometheus, AWS provides a fully managed, secure, and cost-effective service that eliminates the complexities of setting up and maintaining your own Prometheus instance.
With its seamless integration with Amazon CloudWatch and other AWS services, AWS Prometheus offers a holistic monitoring solution that allows you to collect, store, and analyze metrics at scale. The flexibility of PromQL, combined with the managed environment, enables you to query and gain deep insights into your application and system performance with minimal overhead.
Whether you’re working with Kubernetes, containerized environments, or EC2 instances, AWS Prometheus provides the essential tools needed to ensure the reliability, availability, and performance of your applications. Its ability to scale automatically with your workloads means that no matter how large or dynamic your system becomes, AWS Prometheus will grow with you, delivering the real-time metrics necessary for proactive monitoring and troubleshooting.
As cloud-native technologies continue to evolve, adopting a comprehensive and efficient monitoring solution like AWS Prometheus will become increasingly important. With features like automated scaling, built-in security, and robust querying, AWS Prometheus empowers teams to focus on optimizing applications rather than managing complex infrastructure.
Ultimately, by using AWS Prometheus, organizations can improve their operational efficiency, gain better visibility into application performance, and rapidly detect and resolve issues. It’s a critical tool for modern DevOps and cloud teams striving for high availability, low latency, and a seamless user experience in today’s fast-paced, ever-changing cloud environments.
By setting up AWS Prometheus, you are taking a significant step toward achieving effective observability, ensuring that your systems are not only running but are continuously optimized for success.

Add a Comment