DOCKER :
Docker is an open-source platform that enables developers to automate the deployment, scaling, and management of applications in lightweight, portable containers. Containers allow you to package an application with all of its dependencies—like libraries, binaries, and configuration files—into a standardized unit that can run consistently in different computing environments.

PROMETHEUS :
Prometheus is an open-source monitoring and alerting toolkit designed primarily for reliability and scalability. It is widely used to collect metrics from various systems, applications, and infrastructure to help with performance monitoring, troubleshooting, and alerting. Originally developed by SoundCloud, it is now a part of the Cloud Native Computing Foundation (CNCF), alongside other tools like Kubernetes.
To collect Docker metrics with Prometheus, you can use cAdvisor (Container Advisor), which is a monitoring tool created by Google that collects resource usage and performance characteristics of running containers. Here’s a step-by-step guide on how to set up Docker metrics collection with Prometheus.

By following the steps in this guide, you’ve learned how to configure Prometheus to collect Docker metrics, visualize them, and use them to maintain high system reliability. With this foundation, you can expand your monitoring setup to cover additional services and systems, further enhancing your observability infrastructure. Let’s get started!
STEP1:Select your EC2 Instance and click the connect option.

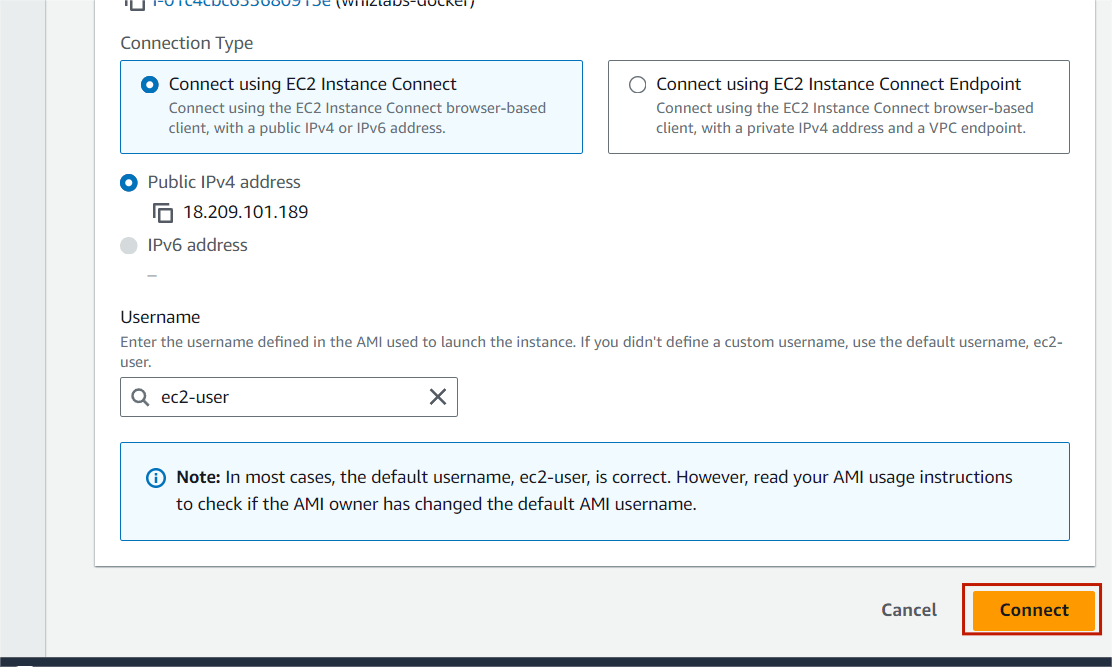
STEP2: A new tab will open in the browser where you can execute the Linux Commands.
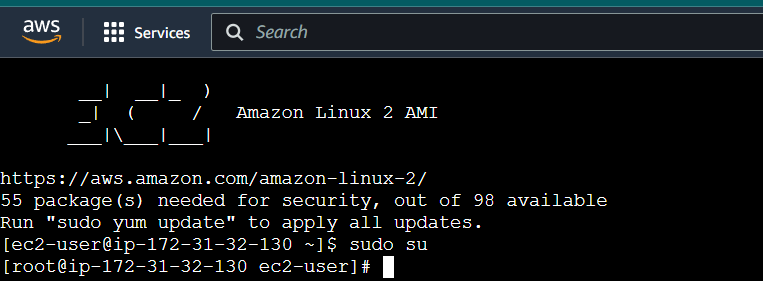
STEP3:Enter the below comments.
sudo susudo nano /etc/docker/daemon.json
STEP4:Enter the following configuration to the daemon.json file and save the file.
{
        "metrics-addr" : "0.0.0.0:9323",
        "experimental" : true
}STEP5:You can restart Docker by executing the following command in PowerShell.
sudo systemctl restart docker.serviceSTEP6:Now, Enter the browser “Your IP address:9323/metrics“
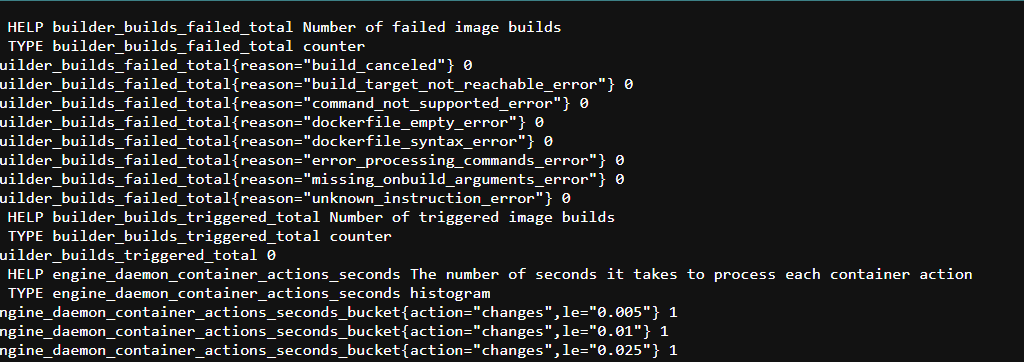
Now You Create a Prometheus Configuration
STEP7:Run the following command to create the Prometheus file:
nano /tmp/prometheus.yml
STEP8:Use the following Prometheus configuration and don’t forget to update the targets with your EC2 instance’s IP address.
# Global config
global:
  scrape_interval: 15s
  evaluation_interval: 15s

  external_labels:
    monitor: "codelab-monitor"

# Load rules and evaluate them periodically
rule_files: []

# A scrape configuration containing Prometheus and Docker
scrape_configs:
  - job_name: prometheus
    static_configs:
      - targets: ["localhost:9090"]

  - job_name: docker
    static_configs:
      - targets: ["<Enter_EC2_Public_IP_here>:9323"]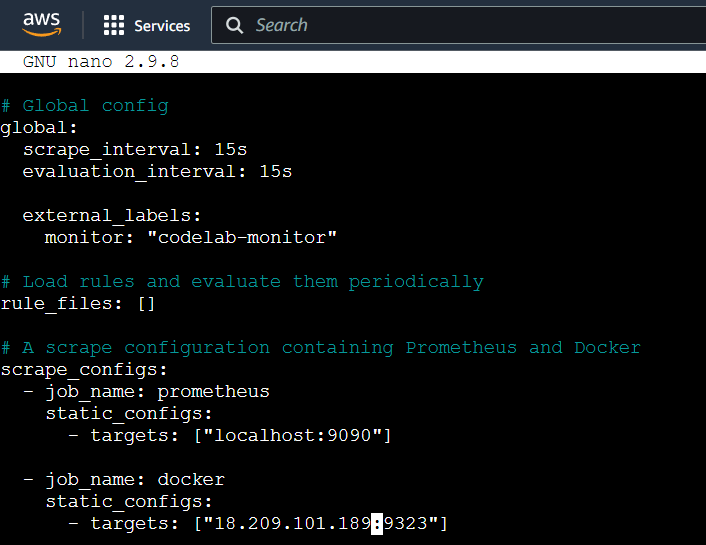
save the file.
STEP9:Launch a Prometheus container using the configuration below.
docker run -d --name my-prometheus --mount type=bind,source=/tmp/prometheus.yml,destination=/etc/prometheus/prometheus.yml -p 9090:9090 prom/prometheus

STEP10:Make sure the Docker target is displayed at http://localhost:9090/targets/ , and add your EC2 instance’s public IP.

STEP11:You will see the following page.
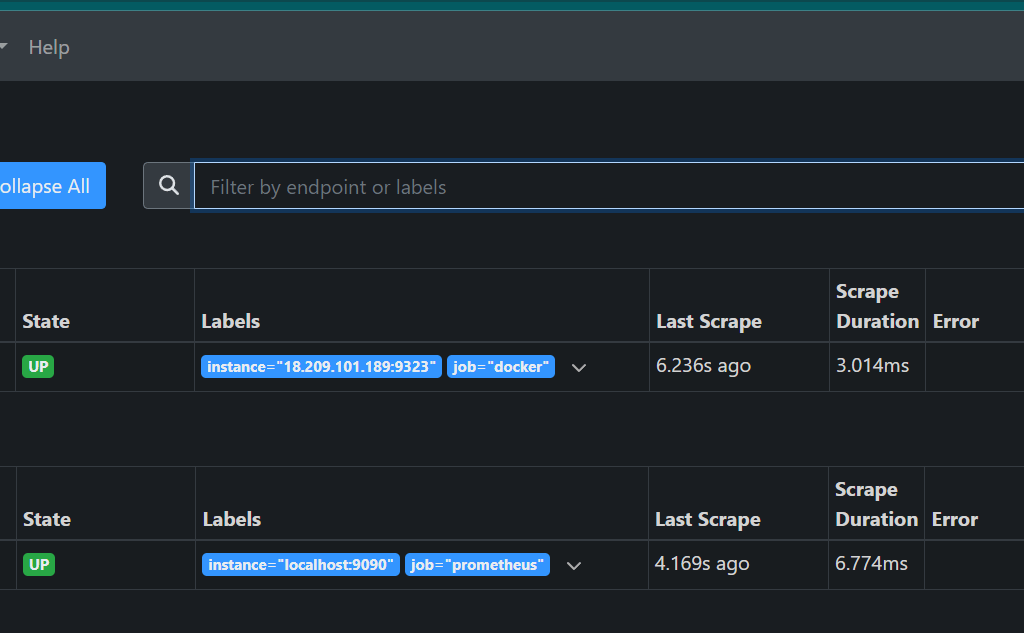
Create a Graph
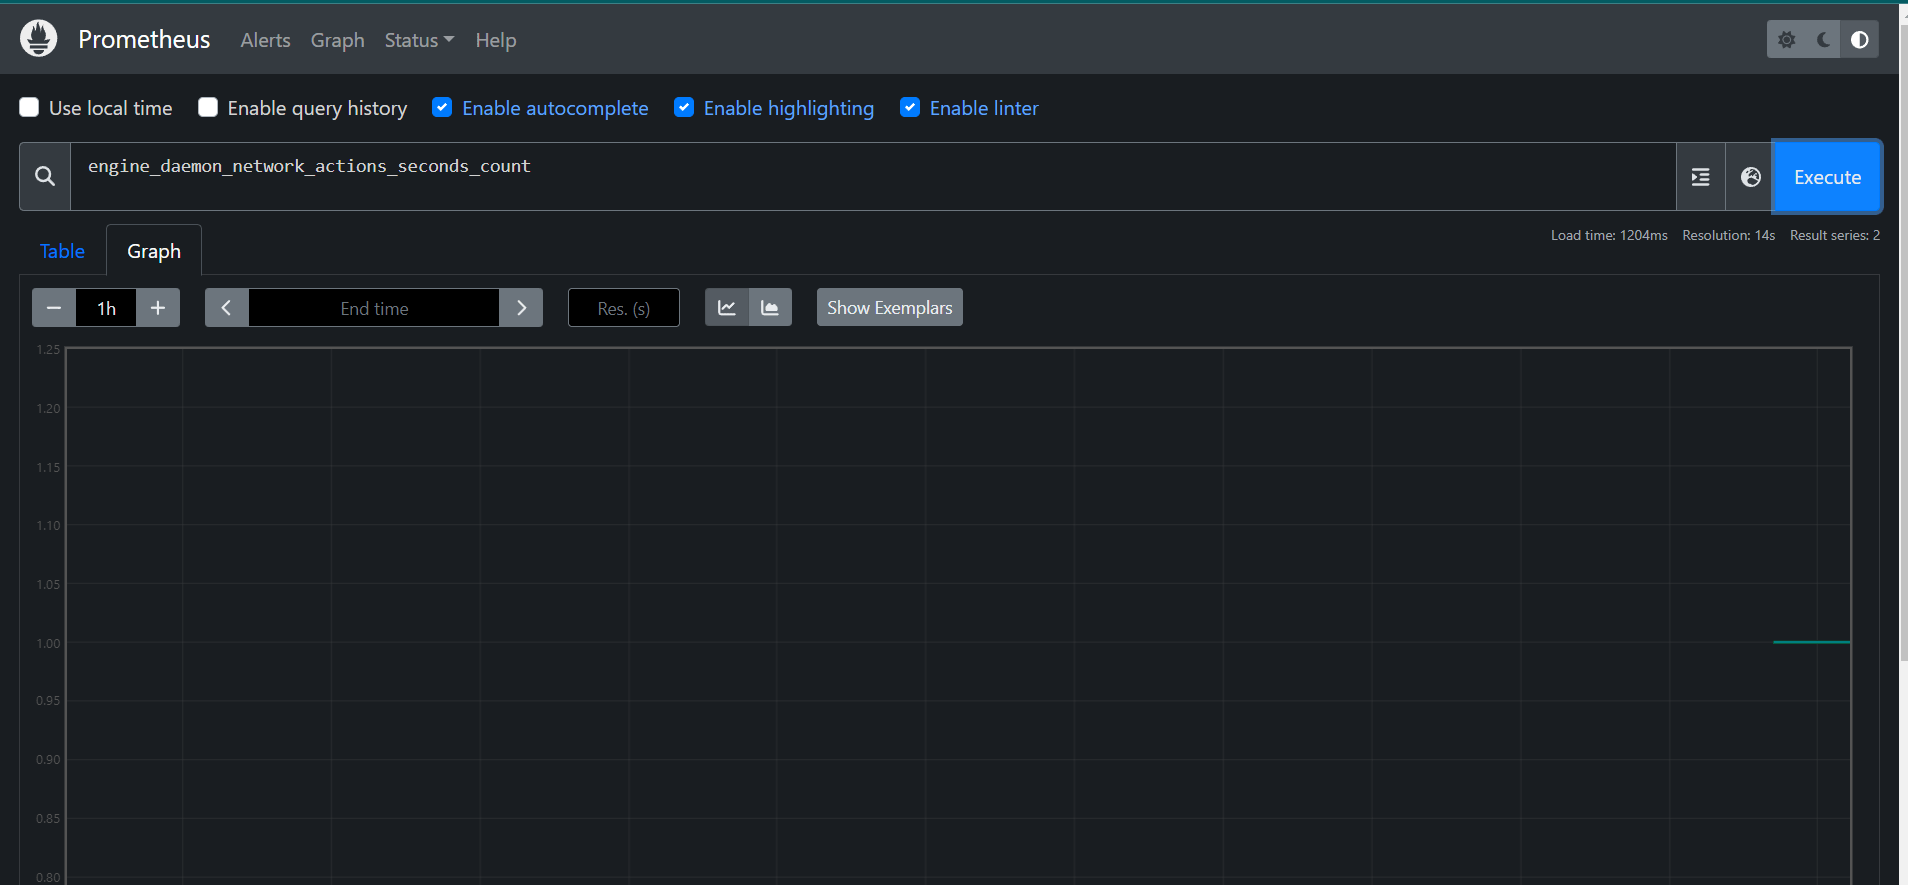
STEP12:In the Prometheus UI, select the ‘Graphs’ link. Then choose a metric from the dropdown next to the ‘Execute’ button, and click ‘Execute’.
Monitor the graph for metrics such as.
engine_daemon_network_actions_seconds_count
STEP13:Launch a container to create network traffic.
docker run --rm alpine apk add git make musl-dev go
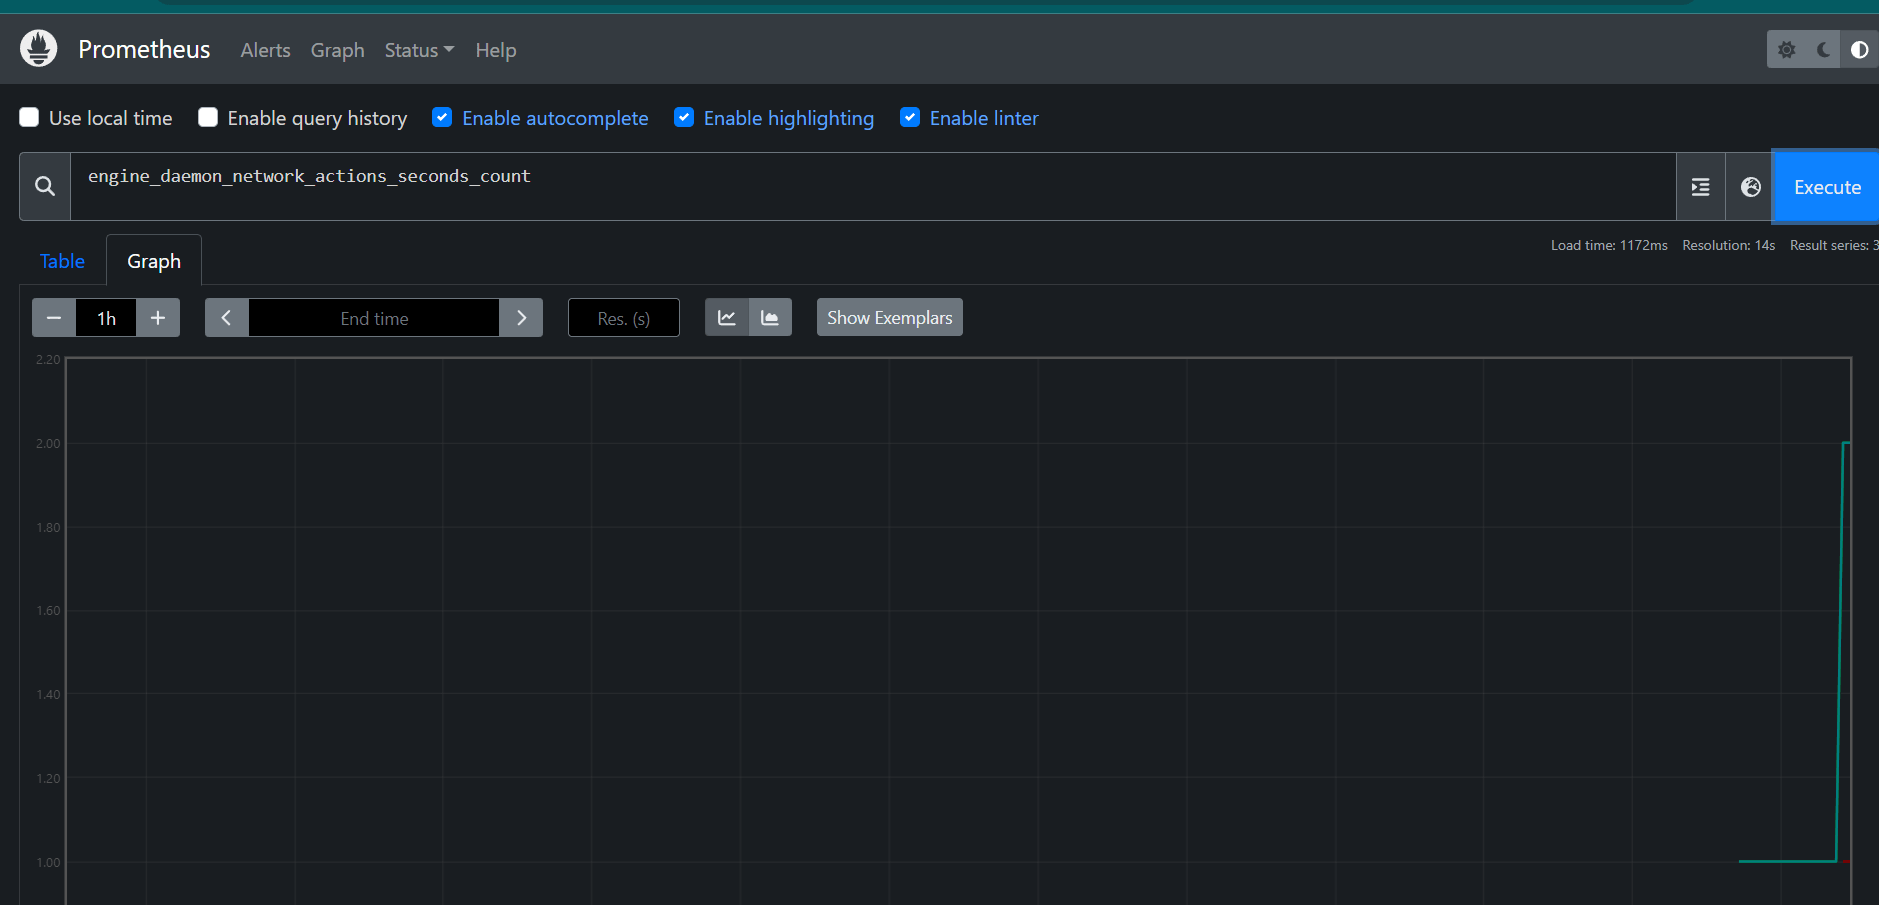
STEP14:Once a few seconds have passed (scrape interval is 15 seconds), refresh the graph in the Prometheus UI.
Look for an uptick in the graph, indicating higher network traffic caused by the active container.

CONCLUSION
You have successfully generated graph metrics. Collecting Docker metrics with Prometheus is a powerful approach to monitoring the performance and health of your Docker containers. By integrating Prometheus with Docker, you can gain real-time insights into key metrics such as CPU usage, memory consumption, and network traffic. This setup enables you to detect issues early, optimize resource usage, and ensure the smooth operation of your applications.

Add a Comment