Introduction.
In today’s fast-paced, cloud-native development world, real-time visibility into application logs is no longer a luxury—it’s a necessity. Whether you’re troubleshooting a production issue, validating a recent deployment, or monitoring a service under load, having immediate access to logs as they are generated can be the difference between minutes and hours of downtime. That’s where the Live Tail feature in Amazon CloudWatch Logs comes into play. Designed to provide a near-instant stream of log data, Live Tail empowers developers, DevOps engineers, and SREs with the tools they need to watch logs in real time—much like the classic Unix tail -f command, but fully integrated into AWS’s cloud ecosystem.
Amazon CloudWatch Logs has long been a central part of AWS’s observability suite, allowing users to store, monitor, and analyze log data from a wide variety of AWS services and custom applications. However, until recently, real-time log monitoring required third-party tools or complex workarounds. With the introduction of Live Tail, AWS now offers a native, easy-to-use solution for streaming logs directly within the CloudWatch console, without requiring any additional setup. This feature helps teams spot issues as they happen, without delay, and take immediate action—whether that means rolling back a deployment, restarting a service, or digging deeper into a stack trace.
What makes Live Tail particularly useful is its seamless integration with other AWS features, such as CloudWatch Alarms, Metrics, and Logs Insights. When used in combination, Live Tail not only helps you see what’s happening now but also gives you the historical context needed to understand why it’s happening. Live Tail supports filtering, so you can narrow down the data stream to just the log events that matter—be it a specific log level, service, or keyword. This is particularly helpful in environments where thousands of logs are generated every second and sifting through them manually would be impossible.
In this guide, we’ll take you step-by-step through using the Live Tail feature in CloudWatch Logs. You’ll learn how to access the CloudWatch console, find your log groups, enable Live Tail, and use filters to refine your view. We’ll also explore some practical use cases and tips to make the most of this feature in your day-to-day operations. Whether you’re new to AWS or an experienced cloud engineer, this tutorial will help you leverage Live Tail to enhance your observability practices and gain more control over your cloud workloads.

By the end of this post, you’ll have a clear understanding of how Live Tail works, when to use it, and how it can help you maintain system health, resolve issues faster, and deliver better uptime for your applications. Let’s dive in.
Step 1: Sign in to the AWS Management Console
- Go to https://console.aws.amazon.com/
- Use your credentials to log into the AWS Management Console.
Step 2: Open the CloudWatch Console
- Navigate to CloudWatch:
- You can find it by typing “CloudWatch” in the AWS services search bar.
Step 3: Go to the Logs section
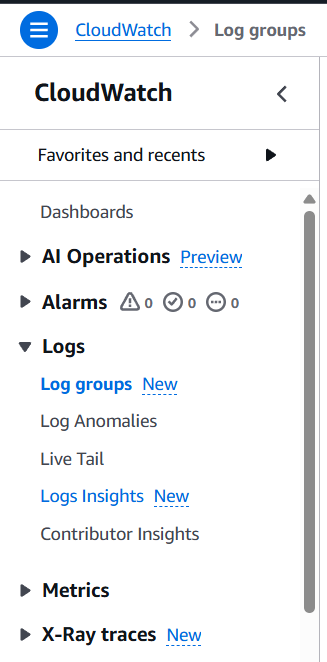
- In the left navigation pane, click on “Logs”.
- Select “Log groups” to view all your available log groups.
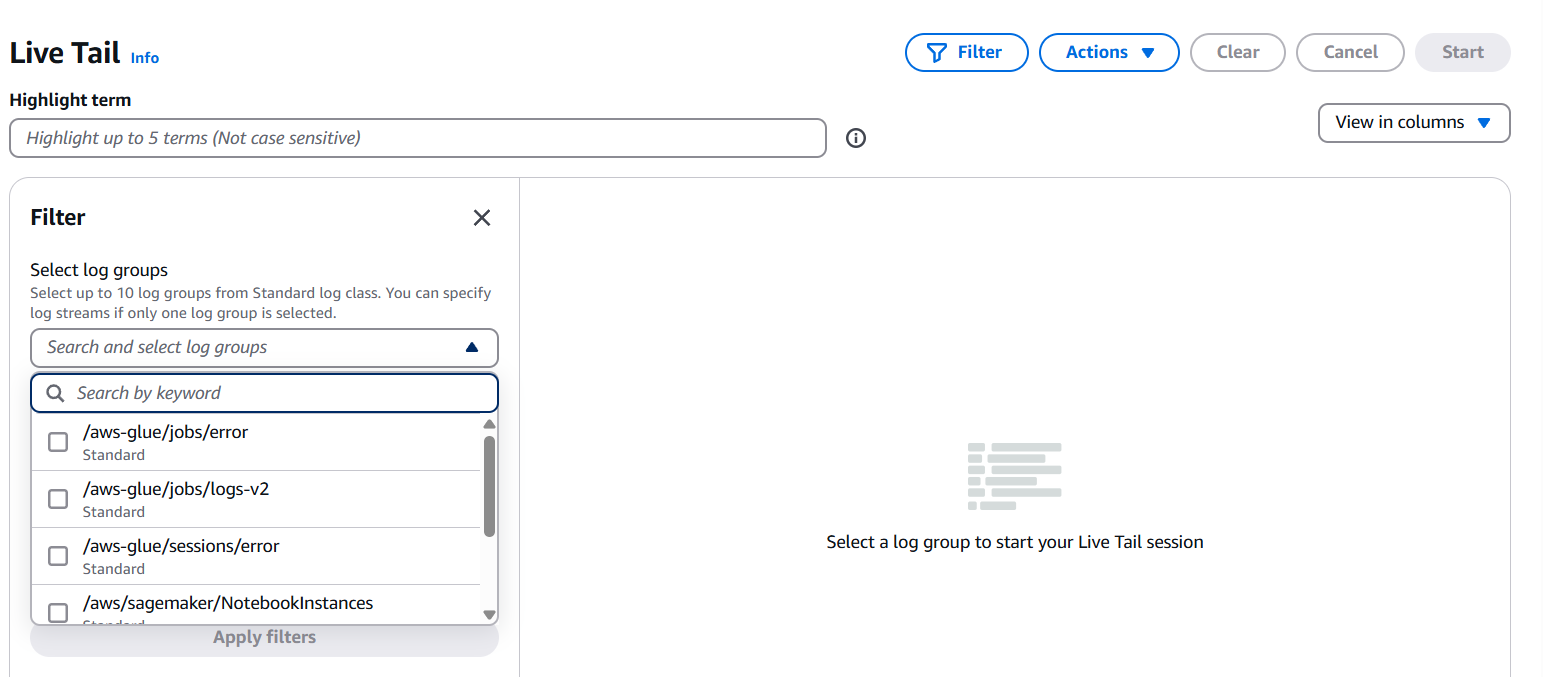
Step 4: Choose a Log Group
- Click on the log group you want to monitor.
- You will see a list of log streams in that group.


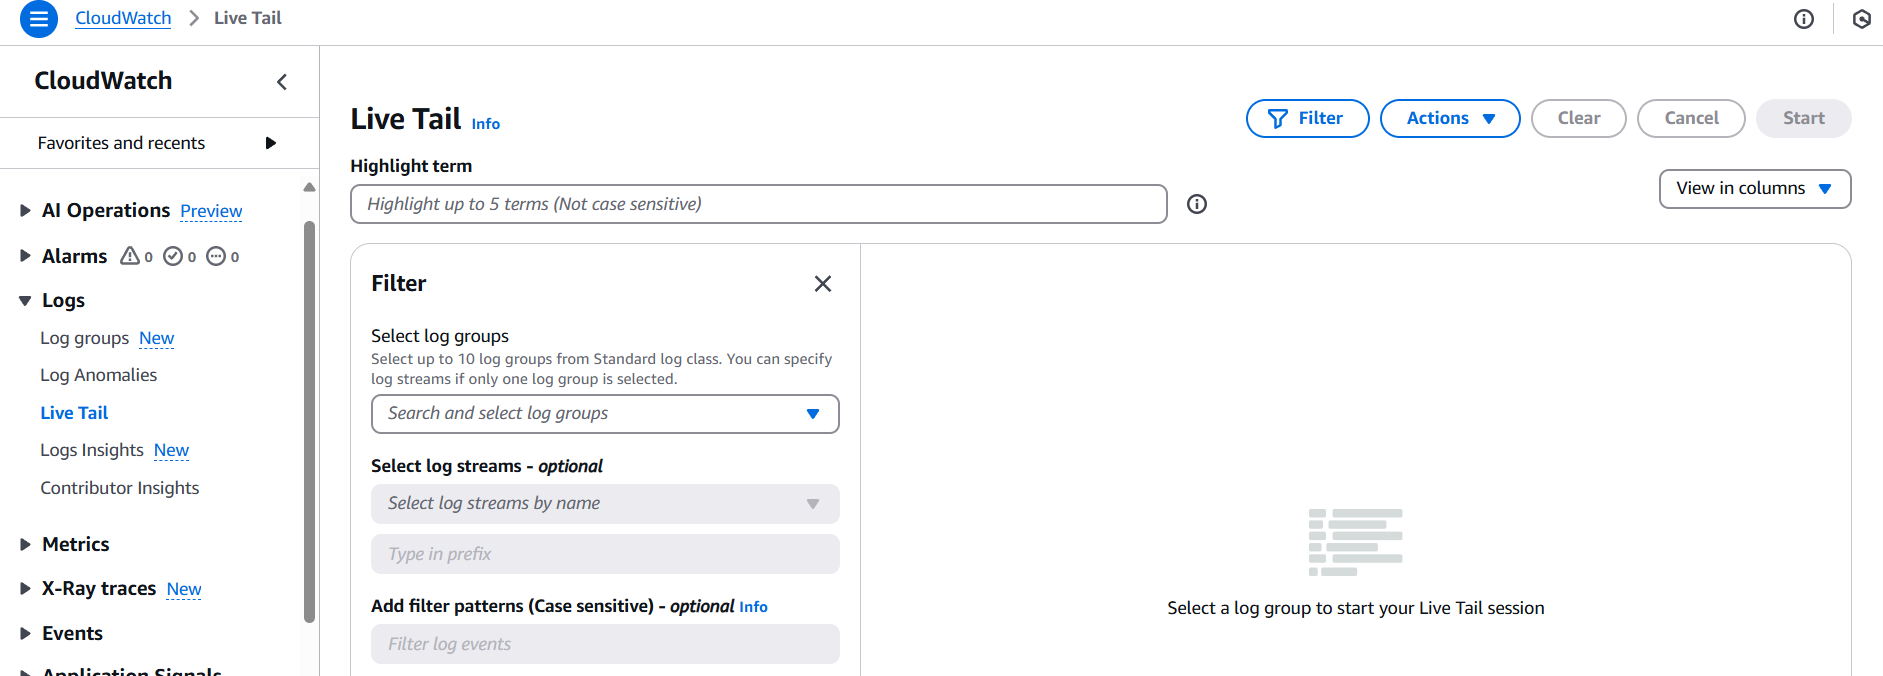
Step 5: Select “Live Tail”
- Click the “Live Tail” button at the top of the log stream list (or inside a specific log stream).
- This opens a real-time view where log events stream in as they occur.

Step 6: (Optional) Add Filters

- You can filter logs using search terms or CloudWatch Logs Insights syntax.
- This helps to focus on specific messages or patterns.
Step 7: Monitor Logs in Real Time
- As new log events are generated, they will appear in the Live Tail view.
- You can pause/resume the stream or clear the view as needed.

Conclusion.
In conclusion, the Live Tail feature in Amazon CloudWatch Logs is a powerful addition to AWS’s observability toolkit, enabling real-time log monitoring directly within the console. Whether you’re debugging an application, watching a critical deployment, or keeping an eye on production systems, Live Tail gives you the immediacy and visibility you need to act fast. It removes the need for external log viewers or complex setups and instead delivers a streamlined, cloud-native solution for modern DevOps and cloud engineers. With the ability to apply filters, pause the stream, and integrate with other CloudWatch tools, Live Tail offers both simplicity and flexibility. If you’re working in AWS and haven’t explored this feature yet, now is the perfect time to start. Real-time insights are just a few clicks away—and they can make all the difference when seconds count.

Add a Comment