Introduction.
In the modern world of cloud computing, monitoring and visualizing system performance, application health, and infrastructure metrics are essential for maintaining high availability and ensuring smooth operations. AWS Managed Grafana is a fully managed service that simplifies this process by providing a cloud-native, scalable solution for visualizing and analyzing data from multiple sources. Grafana, an open-source analytics and monitoring platform, is widely recognized for its powerful capabilities in creating customizable dashboards, integrating with a wide variety of data sources, and providing real-time insights into your data.
Amazon Web Services (AWS) offers AWS Managed Grafana to take the complexity out of deploying and maintaining Grafana. By fully managing the underlying infrastructure, AWS handles the heavy lifting, so you can focus on configuring your Grafana instance, adding data sources, and building dashboards. With AWS Managed Grafana, you can easily connect to AWS services like Amazon CloudWatch, Amazon Elasticsearch, Prometheus, InfluxDB, and many more, enabling seamless integration with your AWS ecosystem.
Setting up AWS Managed Grafana provides numerous benefits, such as reduced operational overhead, automatic scaling, and built-in security features. It is an excellent tool for teams that need real-time visibility into their AWS infrastructure, applications, and logs. Furthermore, because it is fully managed, it removes the need for manually installing, patching, and managing Grafana servers, allowing organizations to focus on their core tasks.
This service is particularly useful for businesses that require centralized monitoring across multiple AWS accounts, regions, and services. Whether you’re tracking metrics related to EC2 instances, RDS databases, Lambda functions, or Kubernetes clusters, AWS Managed Grafana gives you the flexibility to visualize your data in an intuitive, easy-to-understand way.
Moreover, the integration with Amazon CloudWatch allows you to monitor AWS resources, set alarms, and automate actions based on those alarms. Similarly, you can pull data from other services like Prometheus for containerized applications or Elasticsearch for log analytics, making it a versatile tool for full-stack monitoring. Additionally, AWS Managed Grafana supports alerts and notifications, helping you stay informed of critical changes and take action quickly.
Getting started with AWS Managed Grafana is straightforward, thanks to its seamless integration with the AWS Management Console. You can easily set up a Grafana workspace, connect data sources, create dashboards, and configure alerts with just a few clicks. The user-friendly interface allows both beginners and advanced users to quickly grasp how to create insightful visualizations.
In this guide, we’ll walk you through the entire process of setting up AWS Managed Grafana—from creating your workspace to configuring data sources, building your first dashboard, and setting up alerts. Whether you are new to Grafana or an experienced user, you’ll gain the knowledge and skills needed to start using AWS Managed Grafana effectively.

Step 1: Access AWS Managed Grafana
- Sign in to the AWS Management Console using your administrator credentials.
- In the AWS Management Console, search for “Grafana” in the search bar or navigate to Amazon Managed Grafana under the Services menu.
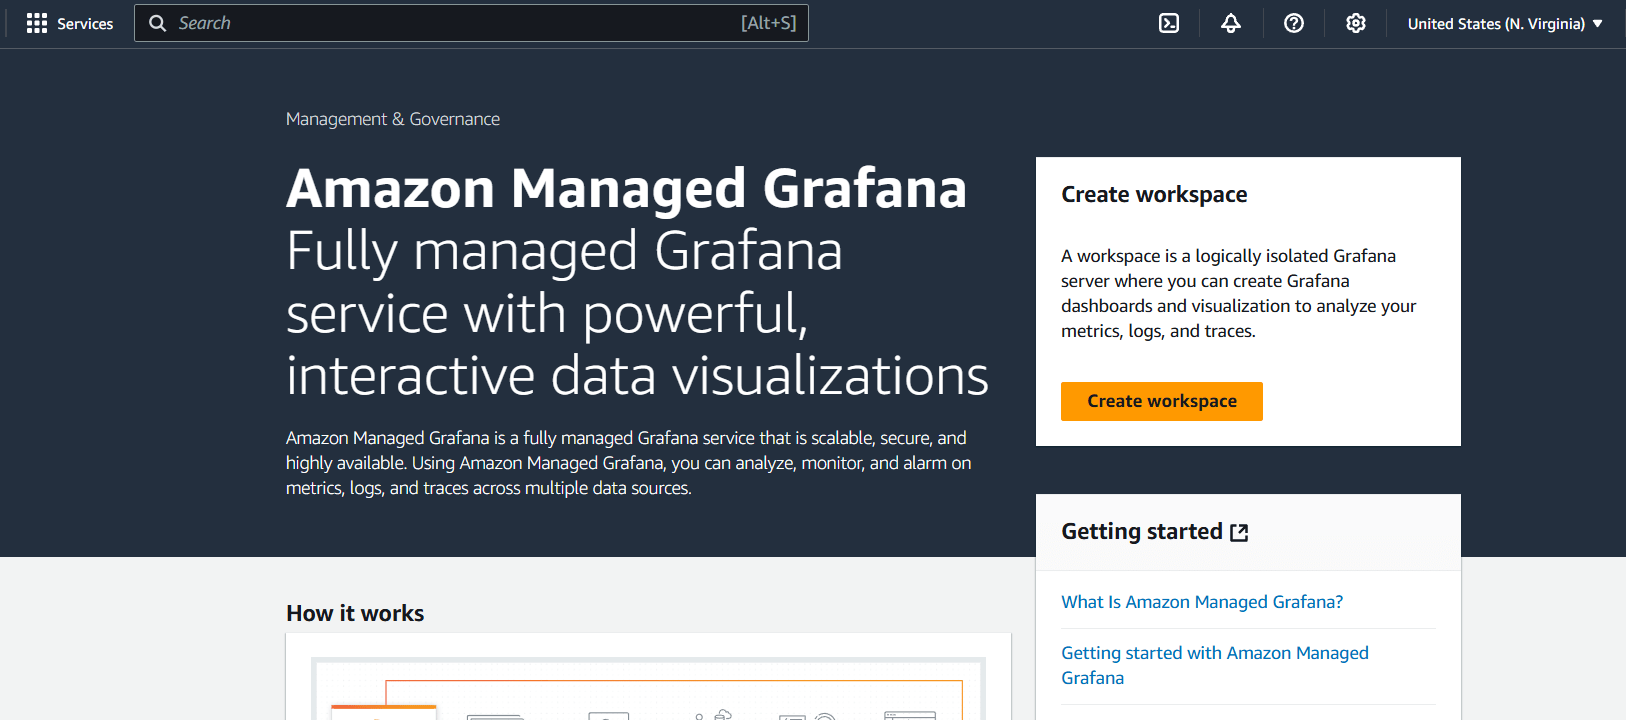
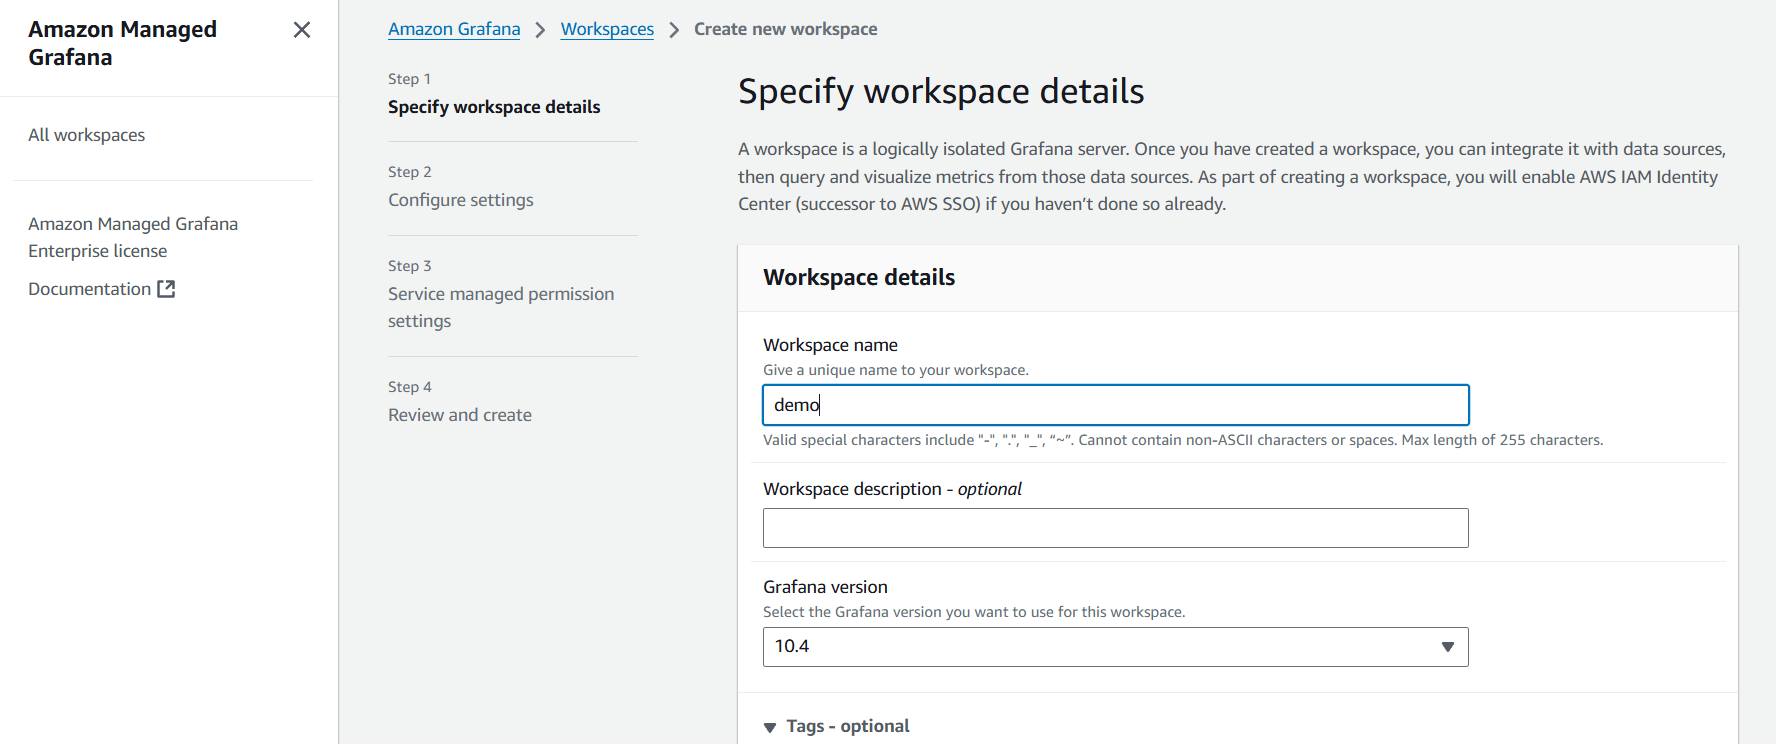
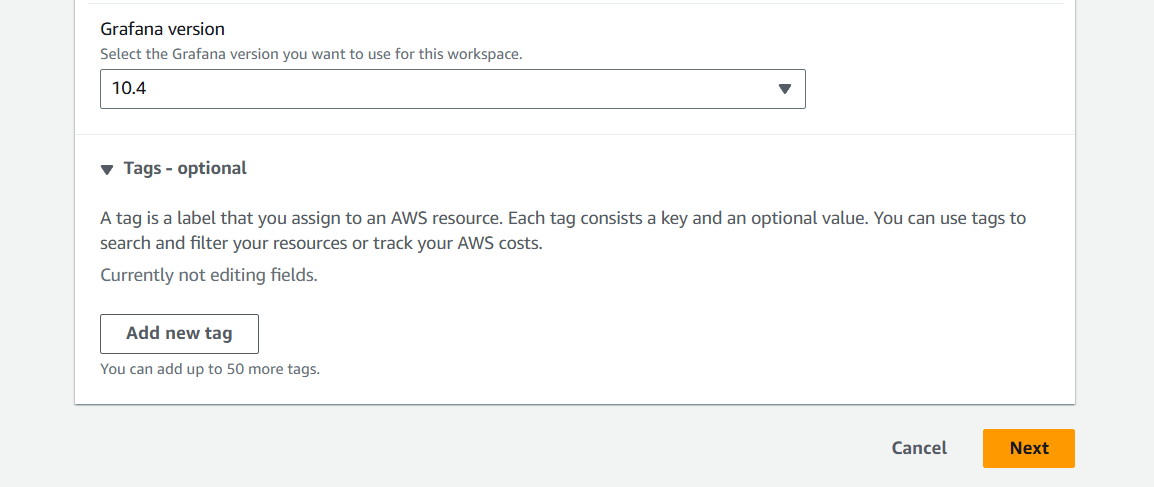
STEP 2: Select your version and click on next.
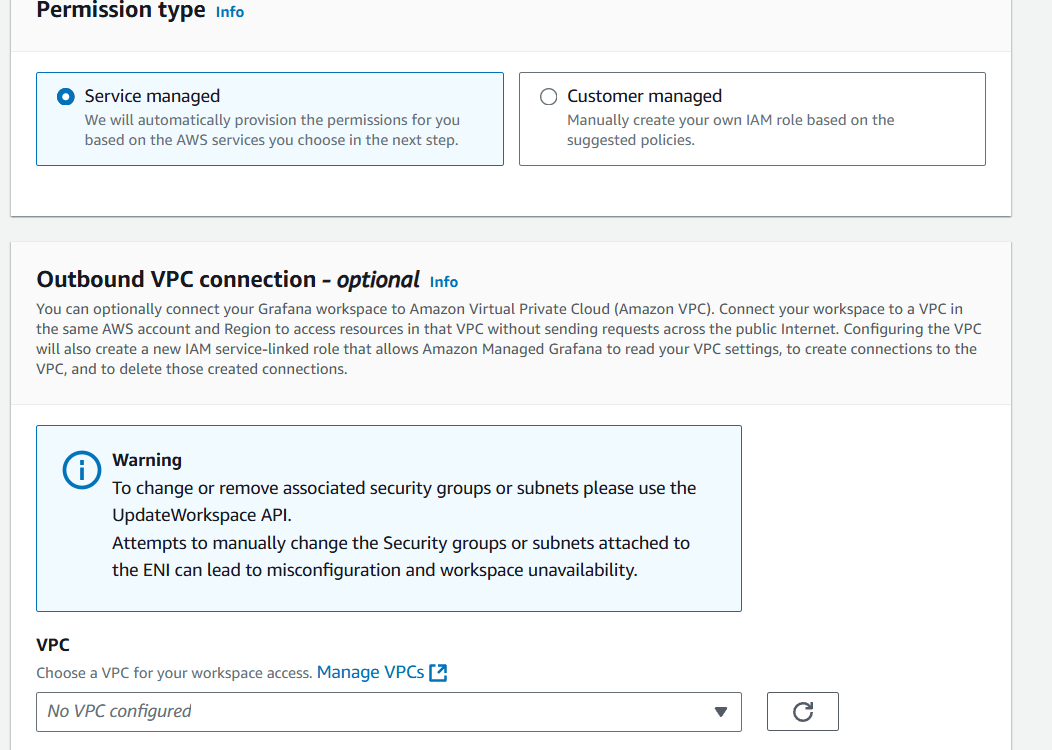
STEP 3: Select the permission type and VPC, Subnet, Security group.
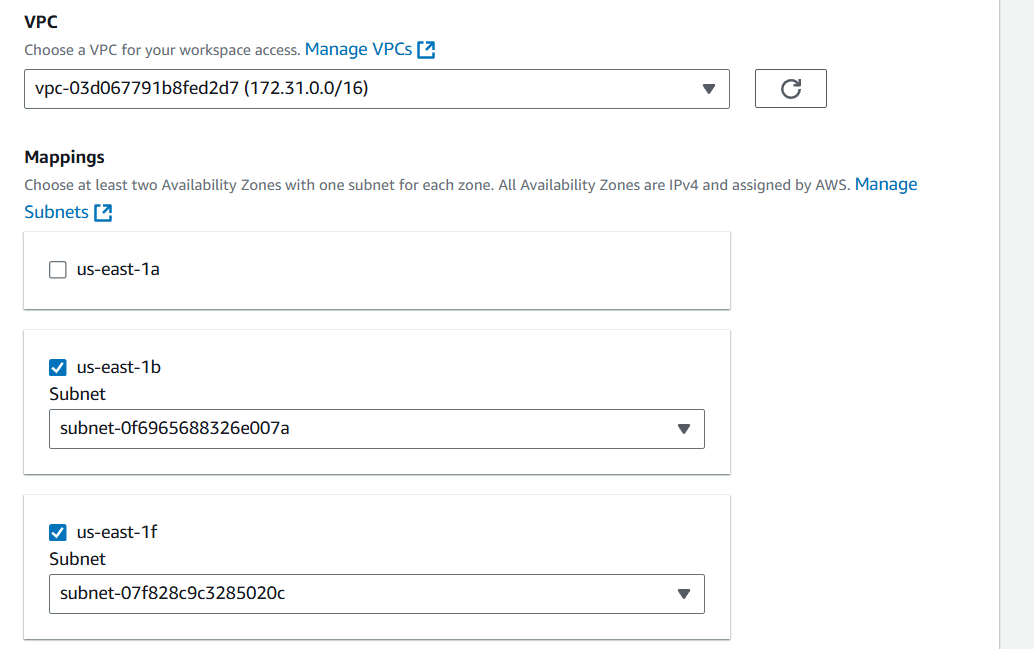
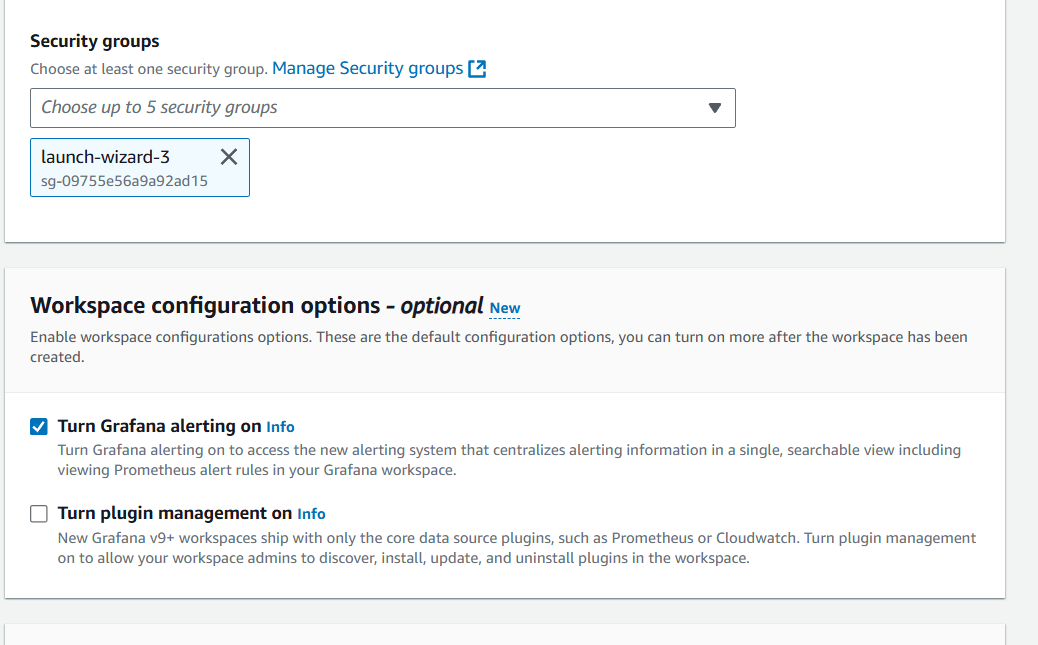
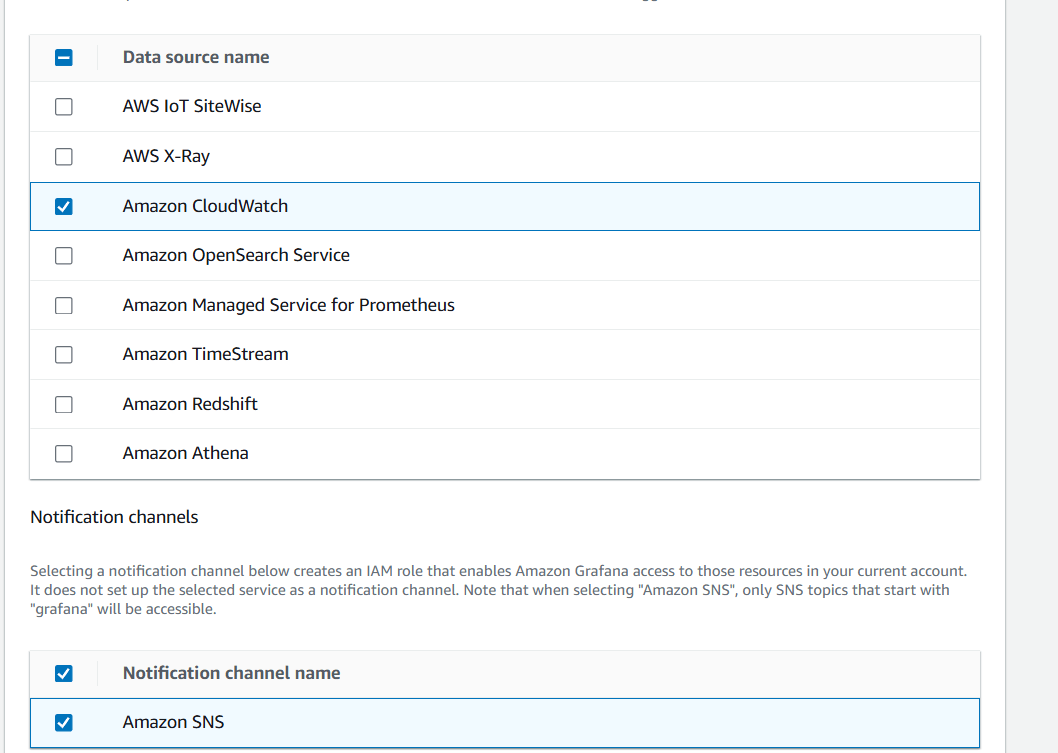
STEP 4: Select data source name and amazon SNS.
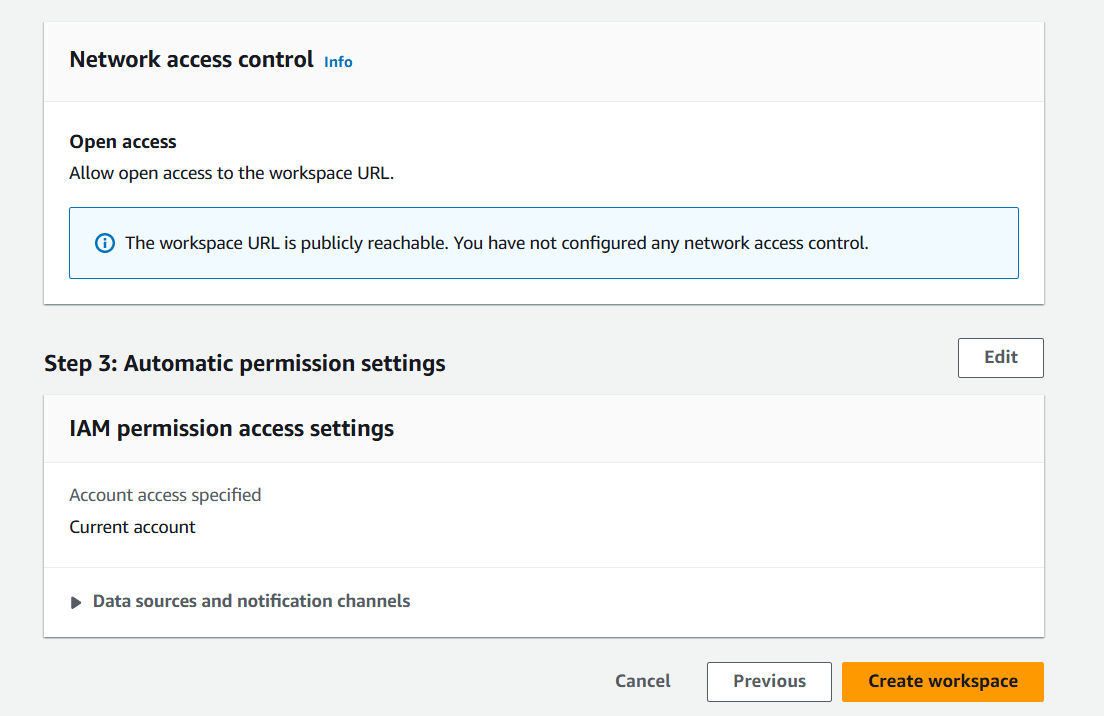
STEP 6: Reviewed and click on create.



Conclusion.
Setting up AWS Managed Grafana allows you to easily visualize and monitor your data without the need for managing infrastructure. By integrating various data sources such as Amazon CloudWatch, Prometheus, and Elasticsearch, AWS Managed Grafana provides a powerful platform for real-time monitoring and analysis.
With the ability to create custom dashboards, configure alerts, and leverage AWS’s scalability, AWS Managed Grafana simplifies the process of observing your AWS resources, applications, and workloads. Whether you are monitoring infrastructure, logs, or application performance, Grafana provides a centralized location for all your monitoring needs.
Now that you’ve learned how to create and configure AWS Managed Grafana, you can start building dashboards, monitoring your metrics, and ensuring the health and performance of your systems in a centralized and efficient manner. Happy monitoring!

Add a Comment