What is Prometheus?
Prometheus is a metrics-based monitoring system and time-series database (TSDB) designed to collect and store metrics data over time. It allows teams to monitor the health and performance of applications, systems, and infrastructure components, especially in microservices and containerized environments.
Prometheus was originally developed by SoundCloud and is now a part of the Cloud Native Computing Foundation (CNCF), the same organization that maintains Kubernetes.

What is Grafana?
Grafana is primarily used to visualize time-series data, which makes it an ideal tool for monitoring and observability in DevOps. It integrates with a variety of data sources, including Prometheus, Elasticsearch, InfluxDB, MySQL, PostgreSQL, Graphite, and more.
Next, I will proceed with the installation of Prometheus and Grafana.
TASK 1: Accessing EC2 instance with ssh.
STEP 1: Create a instance (ubuntu)
- Access the instance with ssh.
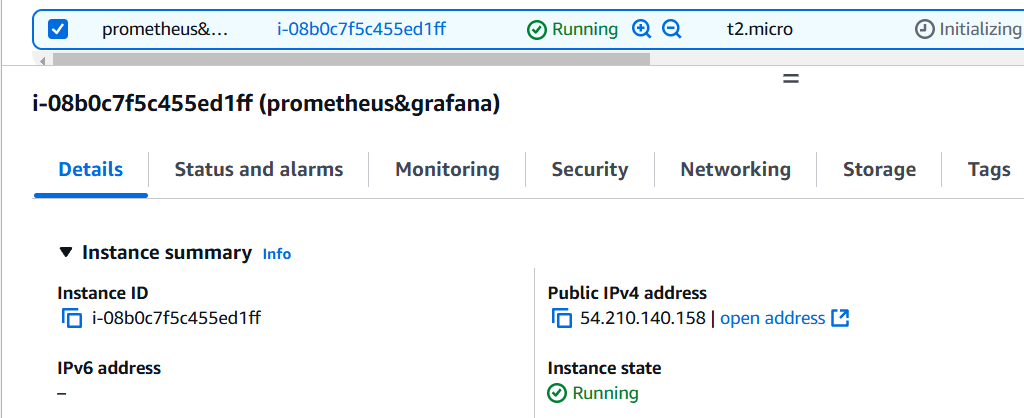
STEP 2: Create a System User for Prometheus.
sudo apt-get update
sudo useradd --system --no-create-home --shell /bin/false prometheus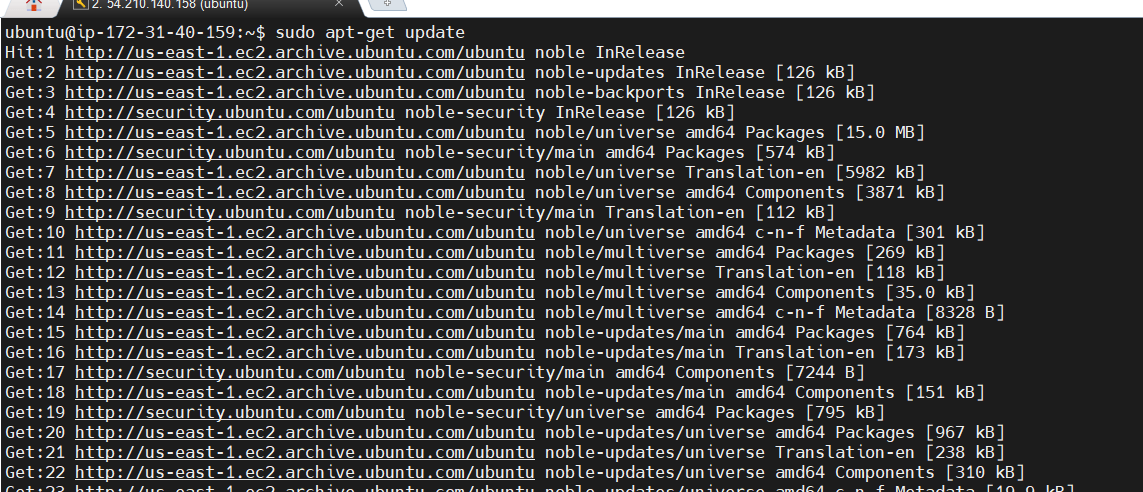
STEP 3: Download the tar.gz file.
wget https://github.com/prometheus/prometheus/releases/download/v2.51.2/prometheus-2.51.2.linux-amd64.tar.gz
tar -xvf prometheus-2.51.2.linux-amd64.tar.gz
cd prometheus-2.51.2.linux-amd64/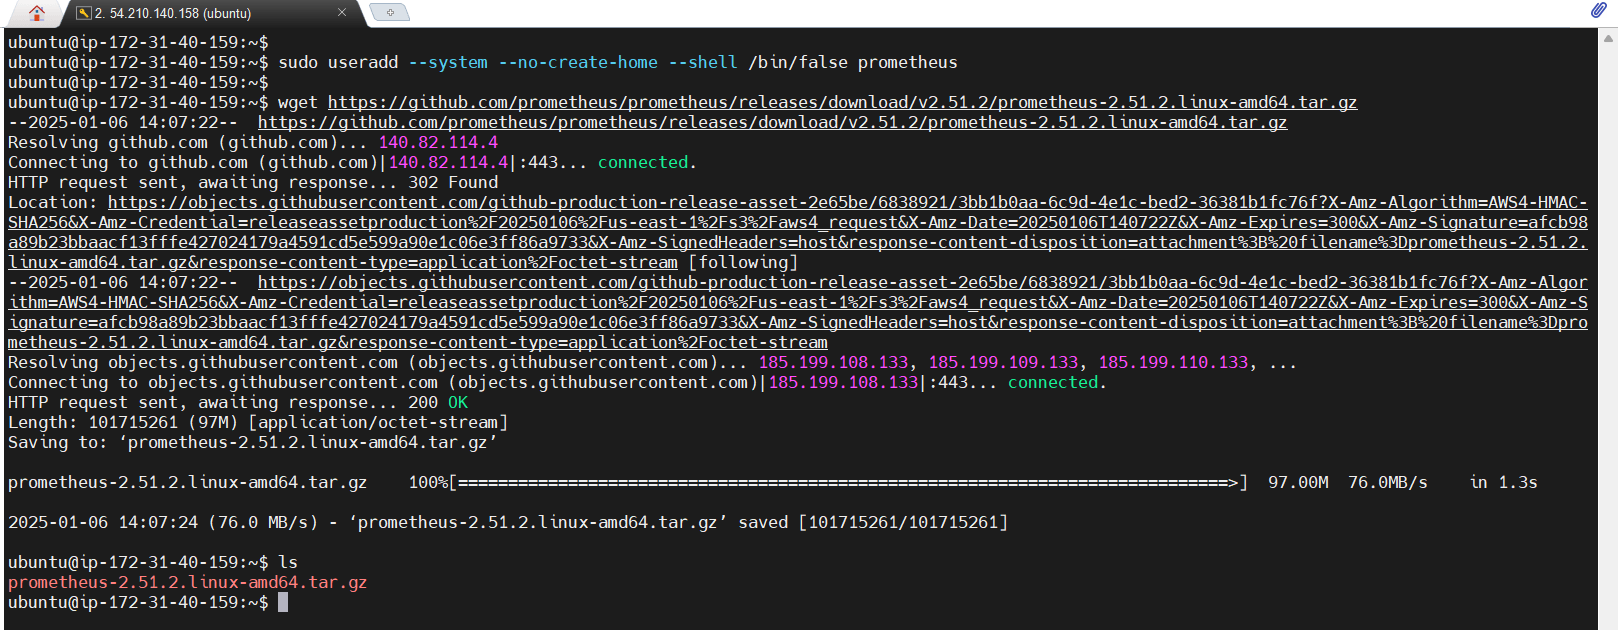
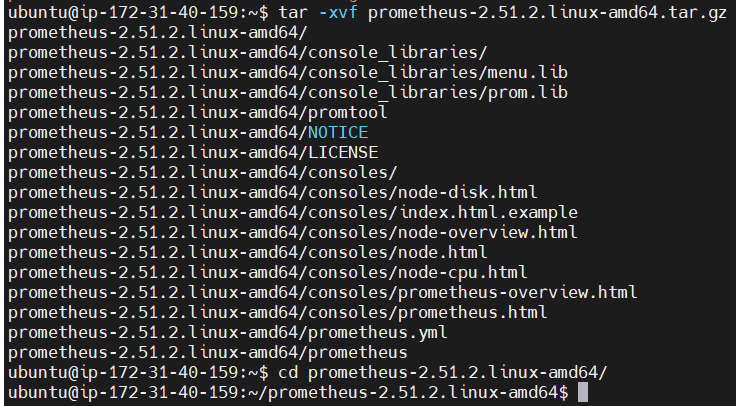
STEP 4: Create a data folder at the root directory, with a prometheus folder inside.
sudo mkdir -p /data /etc/prometheus
sudo mv prometheus promtool /usr/local/bin/
sudo mv consoles/ console_libraries/ /etc/prometheus/
sudo mv prometheus.yml /etc/prometheus/prometheus.yml
sudo chown -R prometheus:prometheus /etc/prometheus/ /data/
STEP 5: Configuring Prometheus as a service.
cd /etc/systemd/system/
sudo touch prometheus.service
sudo nano prometheus.service
STEP 6: Copy and paste the file.
- Save the file.
[Unit]
Description=Prometheus
Wants=network-online.target
After=network-online.target

StartLimitIntervalSec=500
StartLimitBurst=5

[Service]
User=prometheus
Group=prometheus
Type=simple
Restart=on-failure
RestartSec=5s
ExecStart=/usr/local/bin/prometheus \
  --config.file=/etc/prometheus/prometheus.yml \
  --storage.tsdb.path=/data \
  --web.console.templates=/etc/prometheus/consoles \
  --web.console.libraries=/etc/prometheus/console_libraries \
  --web.listen-address=0.0.0.0:9090 \
  --web.enable-lifecycle

[Install]
WantedBy=multi-user.target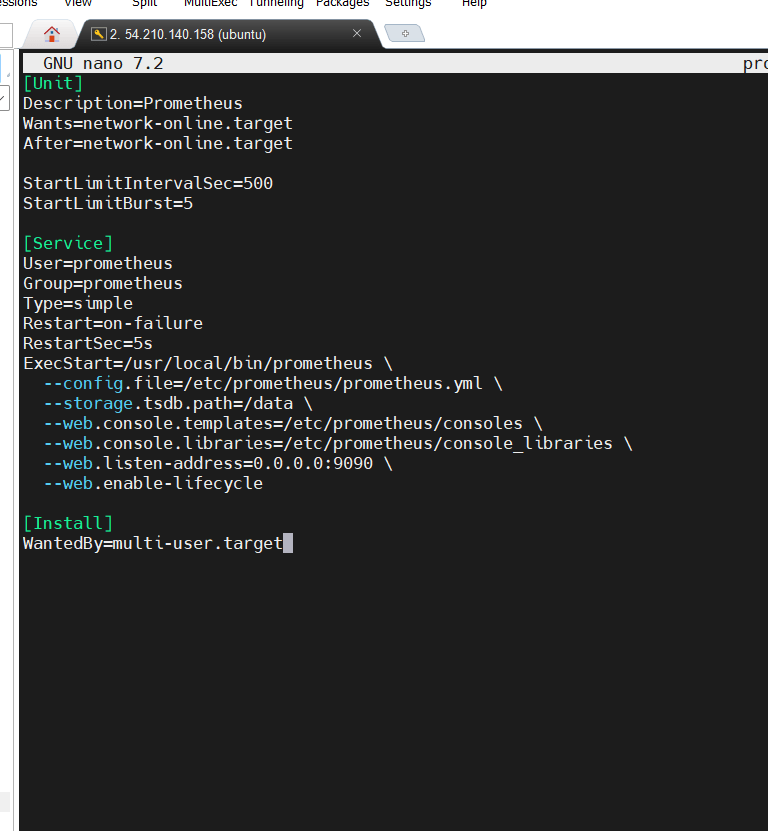
STEP 7: Enable and Start the prometheus.
sudo systemctl enable prometheus
sudo systemctl start prometheus
sudo systemctl status prometheus
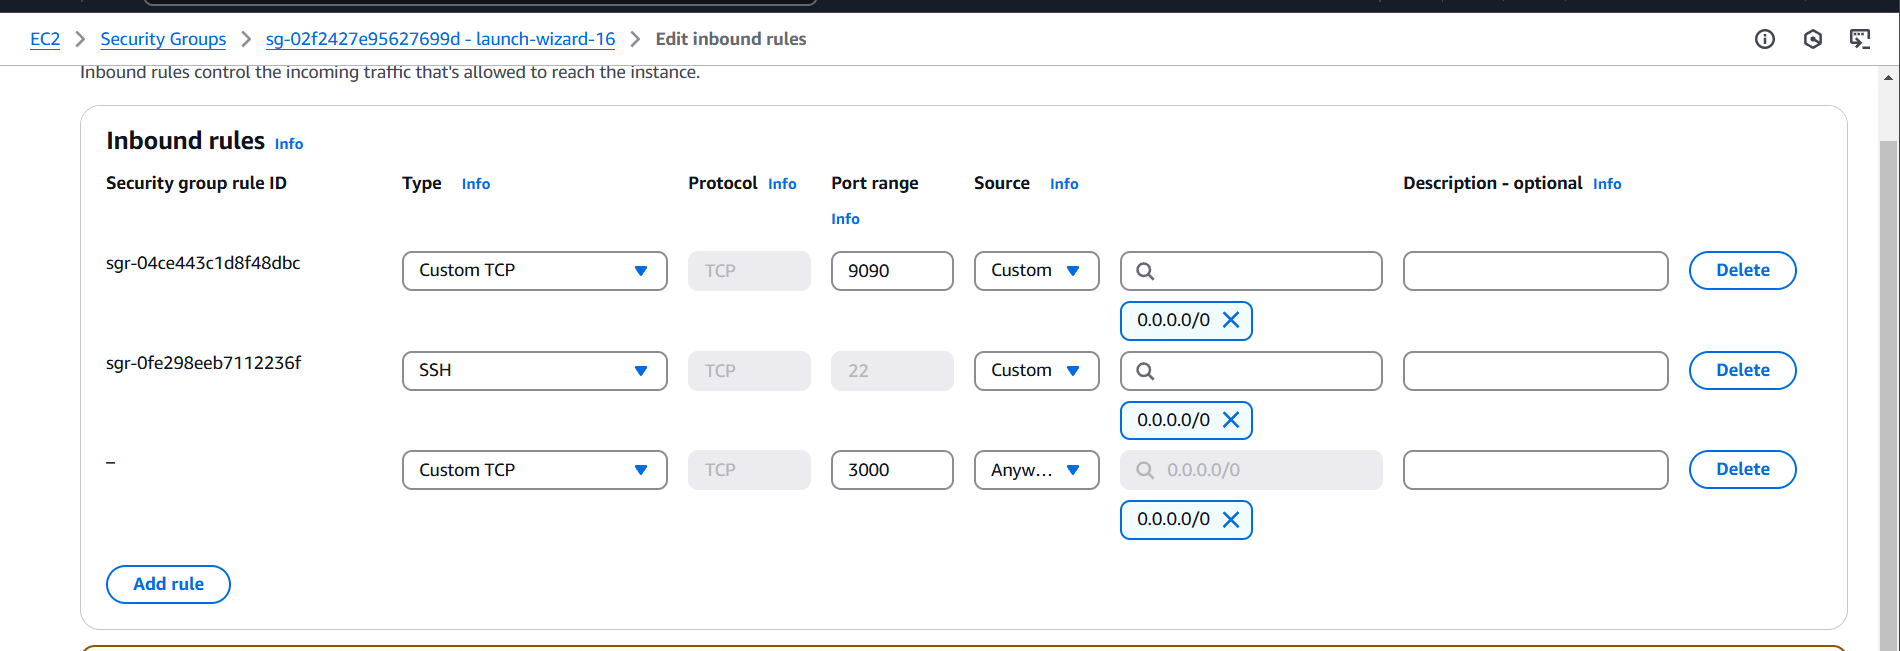
STEP 8: Next, go to the instance, Add the security group.
- 9090 for prometheus.
- 3000 for grafana.
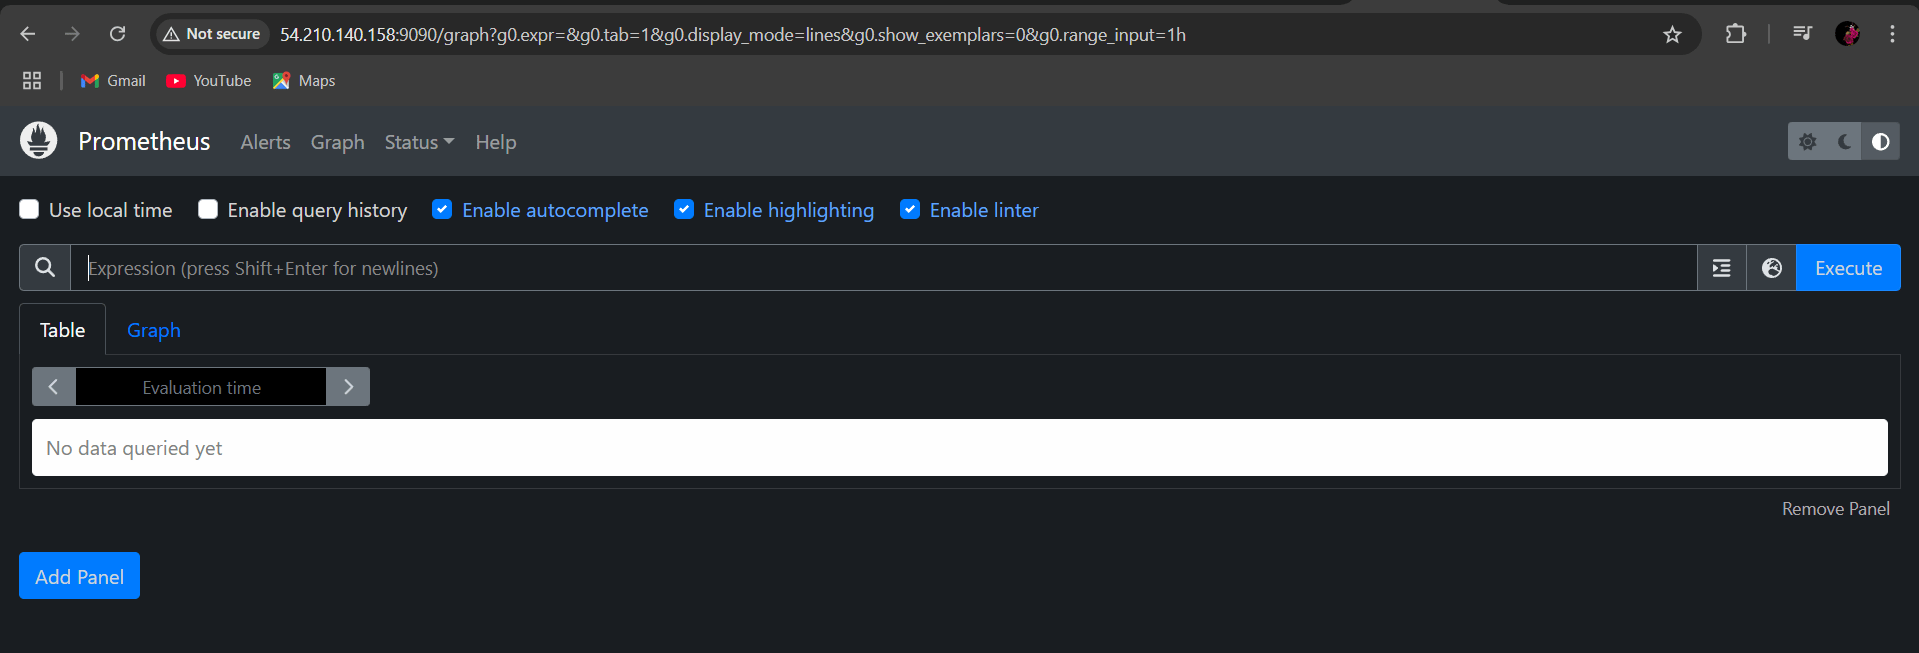
STEP 9: Go to browser type http://<your IP address>:9090/
- You will see prometheus dashboard.
TASK 2: Install Grafana.
STEP 1: Install grafana use the following command.
sudo apt-get install -y apt-transport-https software-properties-common
wget -q -O - https://packages.grafana.com/gpg.key | sudo apt-key add -
echo "deb https://packages.grafana.com/oss/deb stable main" | sudo tee -a /etc/apt/sources.list.d/grafana.list
sudo apt-get update
sudo apt-get -y install grafana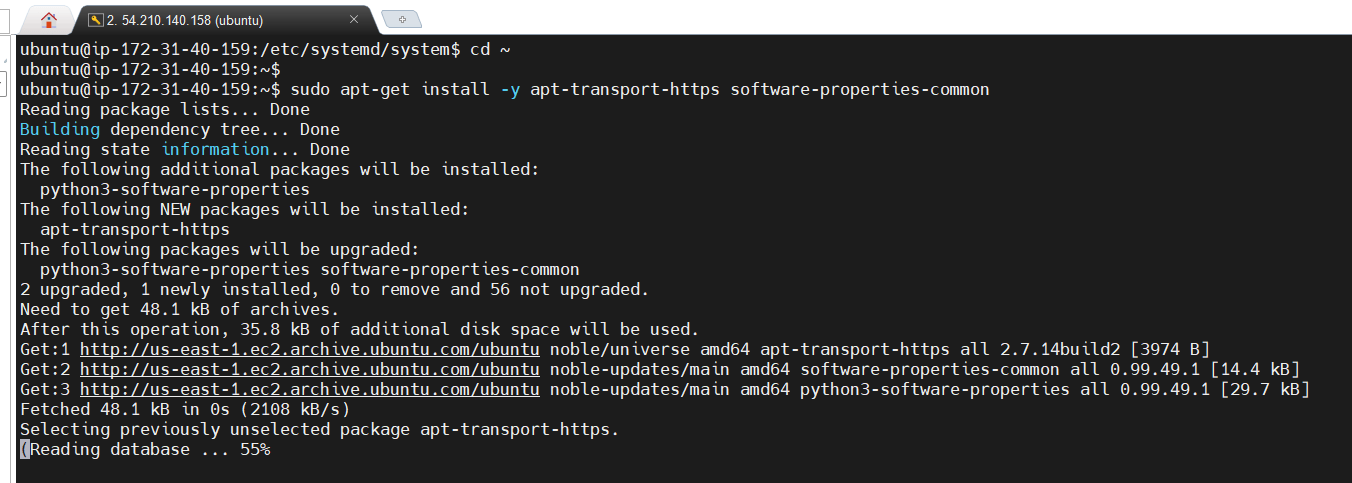


STEP 2: Enable and start the grafana server.
sudo systemctl enable grafana-server
sudo systemctl start grafana-server
sudo systemctl status grafana-server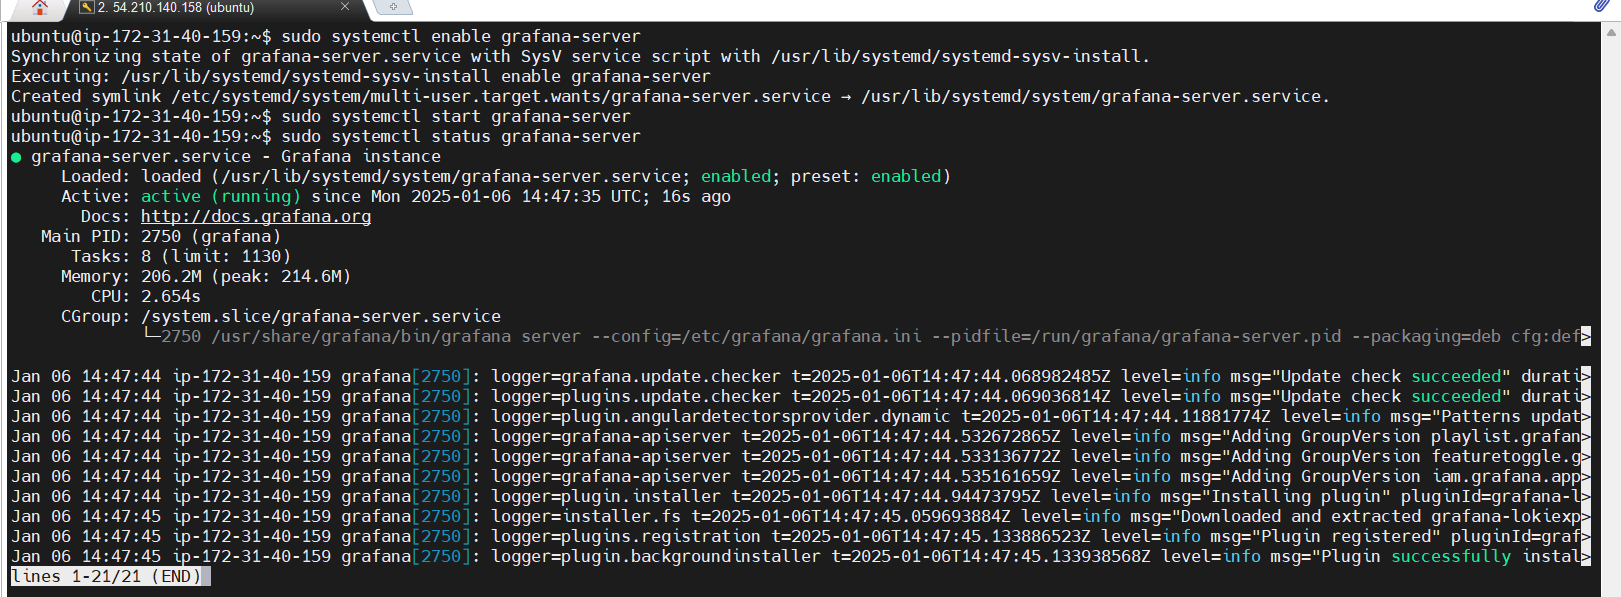
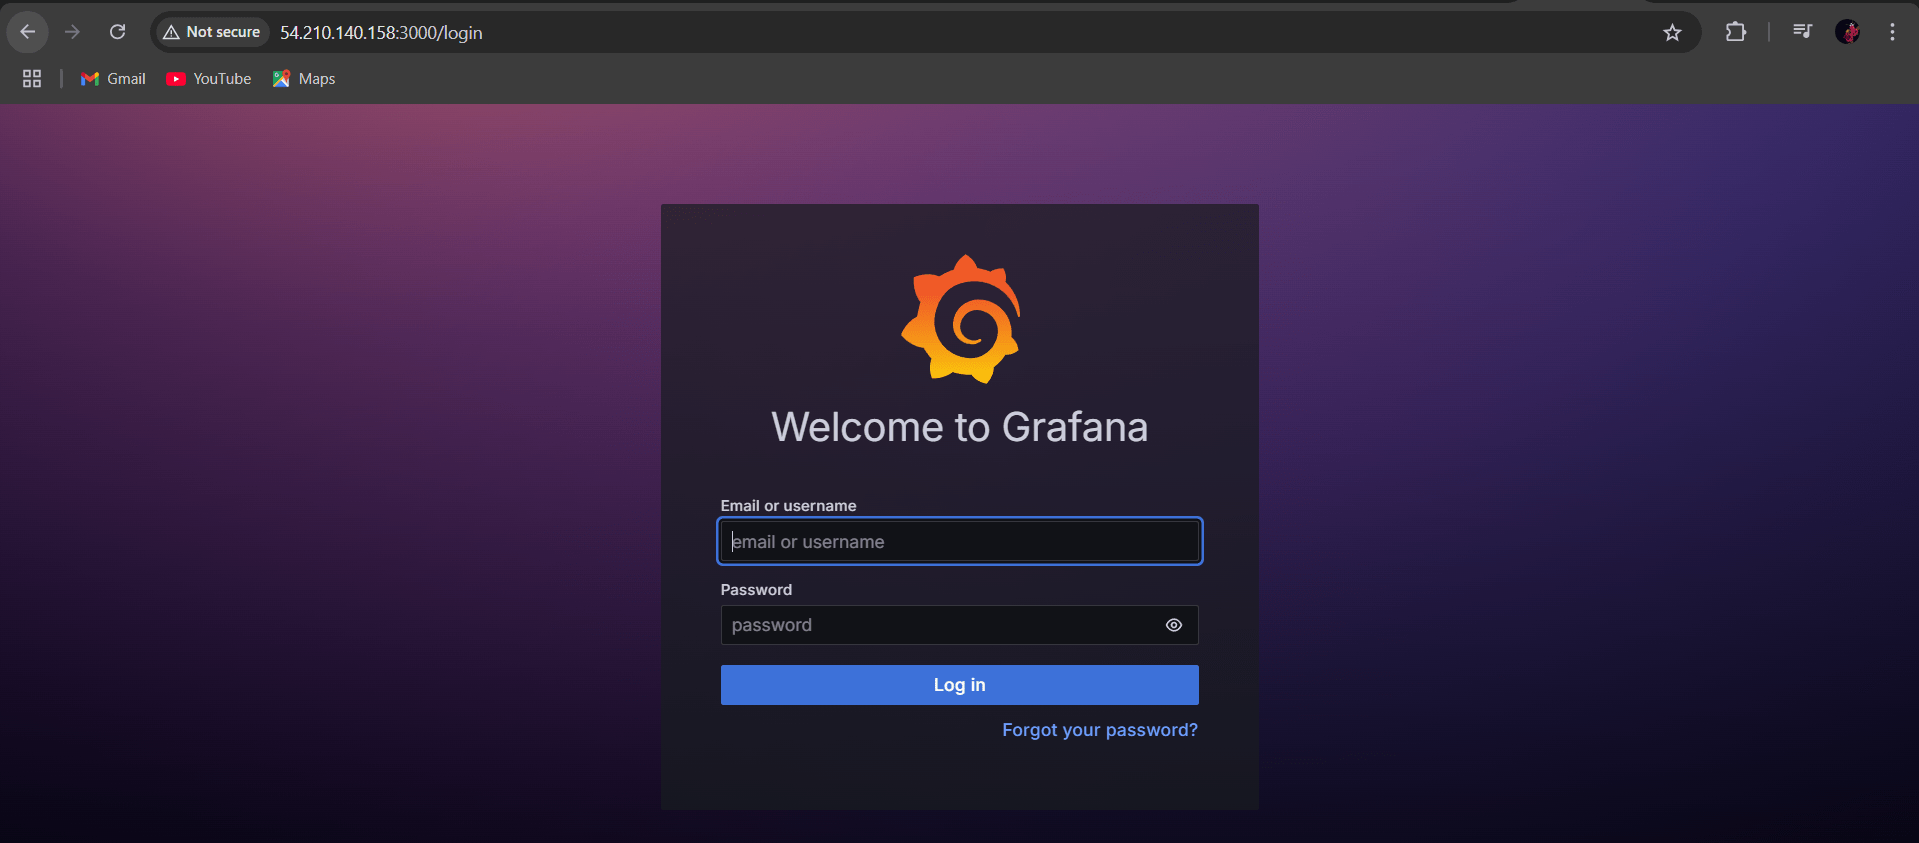
STEP 3: Type your browser http://<your IP address>:3000
- Enter the username: admin
- Password: admin
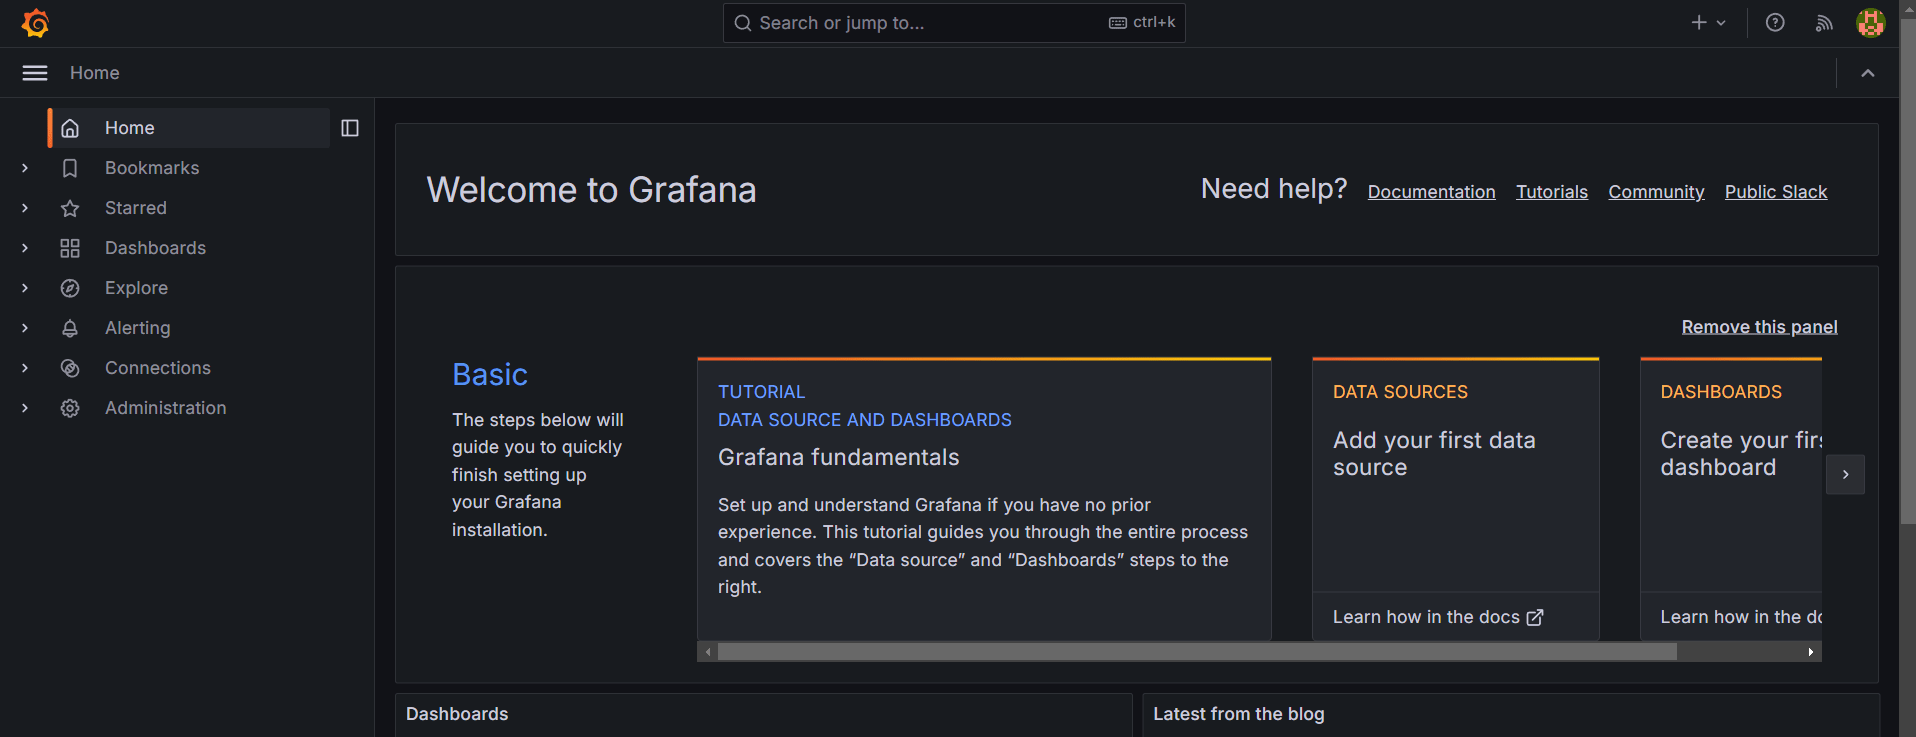
STEP 4: You will see grafana dashboard.
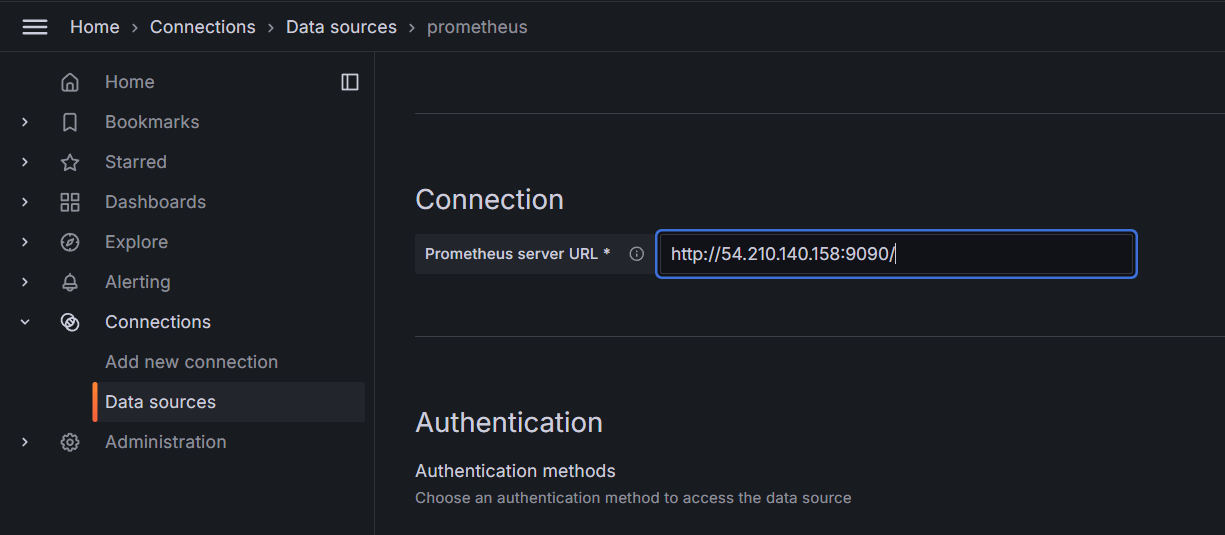
STEP 5: Click data sources select prometheus and enter the prometheus url.
- Click on save and test it.



Conclusion.
In this guide, we’ve walked through the essential steps for installing and configuring Prometheus and Grafana, two of the most powerful and popular tools in modern DevOps and cloud-native monitoring. Prometheus, with its robust time-series data collection and querying capabilities, allows you to monitor system health, performance, and operational metrics with precision. On the other hand, Grafana empowers you to visualize that data in beautiful, interactive dashboards that facilitate real-time insights and effective decision-making.
In the end, monitoring and observability are not just about preventing issues—they’re about empowering your team with the data they need to optimize and improve the performance of your systems continuously. Happy monitoring!

Add a Comment