A Comprehensive Introduction:
Cost Explorer is a powerful tool provided by AWS (Amazon Web Services) that helps users analyze and manage their cloud spending. It provides insights into your AWS usage and costs, helping you understand where your money is being spent and how to optimize your resources for cost efficiency. Amazon Cost Explorer provides detailed visibility into your AWS spending, allowing you to understand where your money is going across different services, regions, and usage patterns.
It goes beyond just numbers; it’s about empowering users to make informed decisions and ensuring that cloud budgets remain in check. The integration of the AWS Cost Management console with the Billing console provides a holistic approach to managing ongoing payments and optimizing future costs.
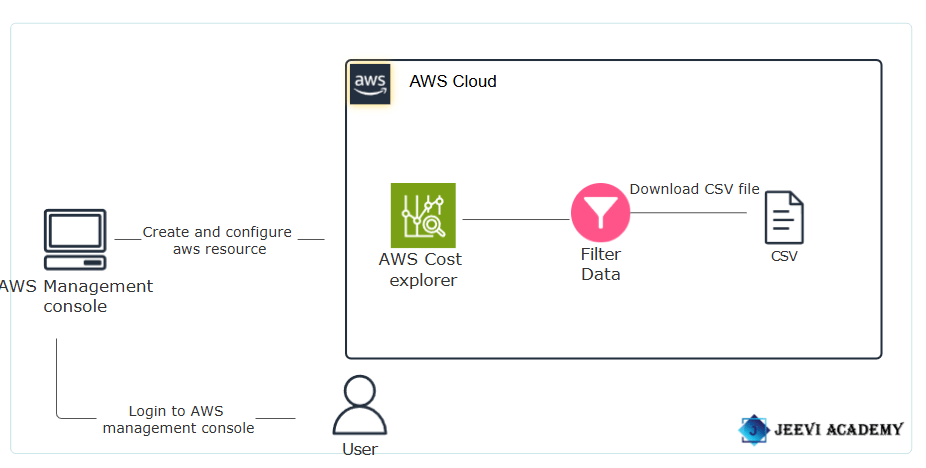

Benefits of AWS Cost Explorer:
Improve Budgeting: Use historical data to make informed forecasts for future spending.
Cost Forecasting: Estimate spending for the next 12 months.
Cost Explorer API: Programmatic access for automation.
Free User Interface Access: No additional charges for UI usage.
Identify Cost Drivers: Understand which services contribute most to your costs.
Use Cases:
AWS Cost Explorer is a powerful tool that helps you visualize, understand, and manage your AWS costs and usage.
Integration with AWS Budgets: Cost Explorer can be integrated with AWS Budgets for a comprehensive cost management strategy, allowing users to track costs and receive alerts.
Cost Monitoring and Visibility: Gain insights into ongoing AWS costs for visibility and control.
Resource Optimization: Utilize Reserved Instances recommendations for strategic cost optimization.
Cost Explorer Console:
STEP 1 : Navigate to Cost Explorer by clicking on the Services menu.

STEP 2 :Click on Cost Explorer in the left panel.
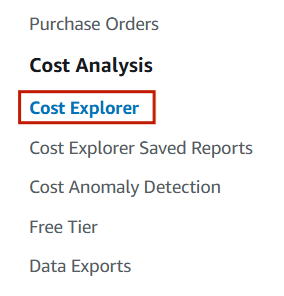
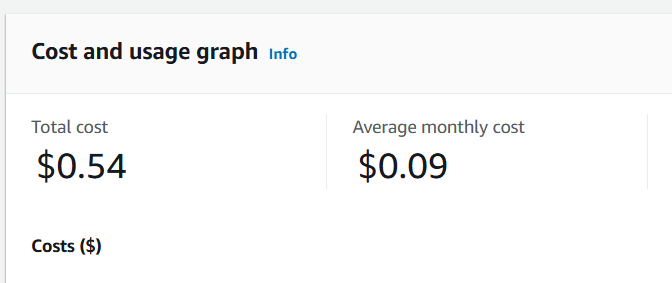
STEP 3 : It’s open the cost dashboard.
- Your Total cost, Estimated average costs for the month and Total number of services used.
STEP 4 :Cost Explorer offers three different styles for visualizing your cost data.
- Bar.
- Stack.
- Line.
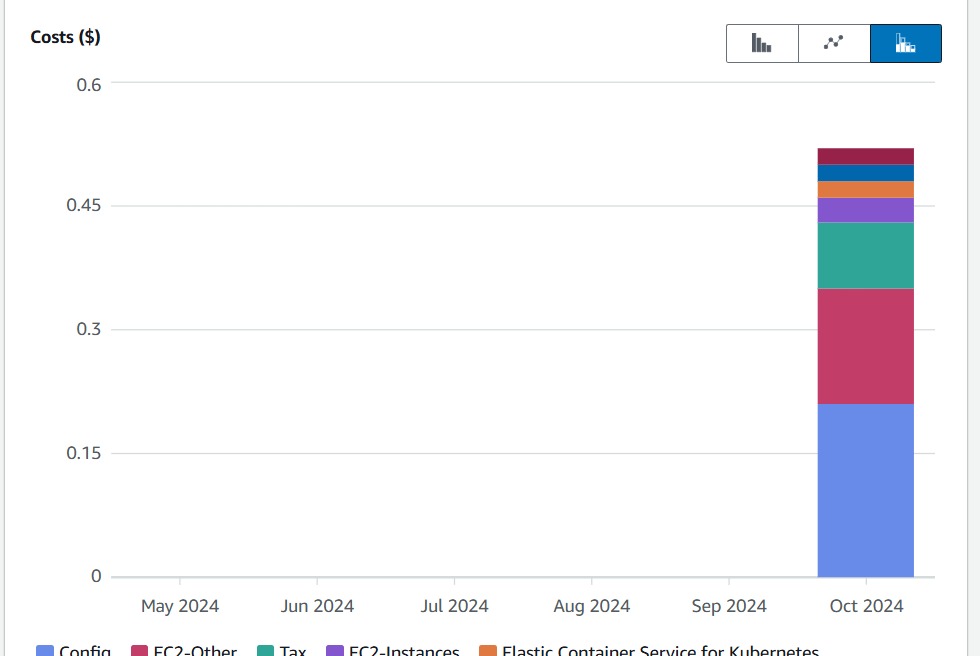
Filter the data:
1.Select a date range and choose ‘1 month’ to filter data from the last month, then click the ‘Apply’ button.
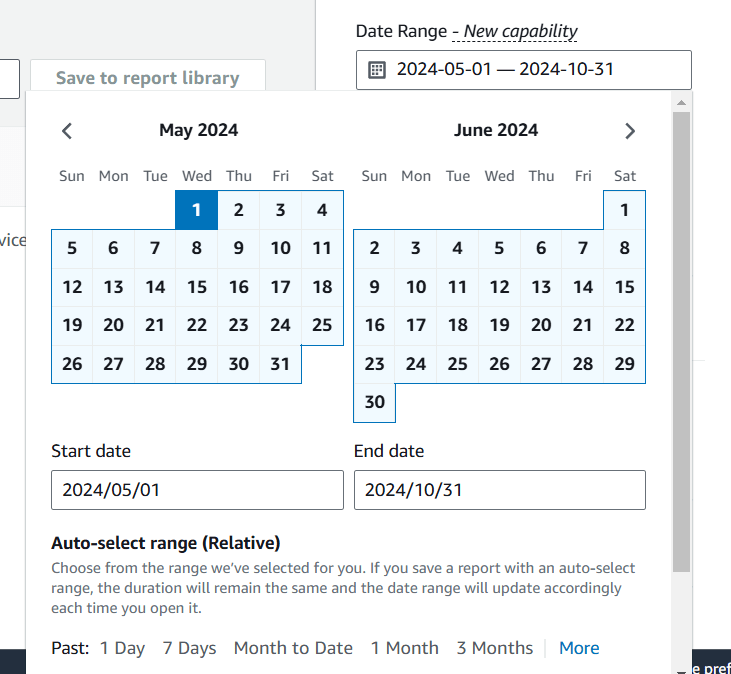
2.Additional filters are available based on dimensions like service, linked account, region, etc.
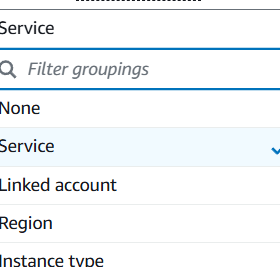
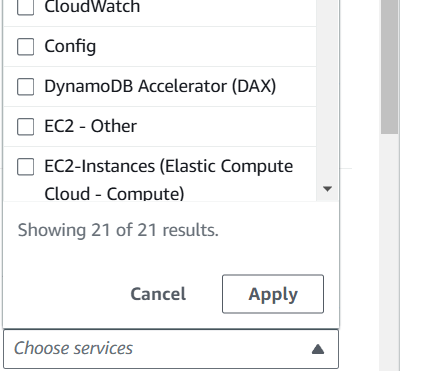
Filter specific service:
For a specific service type, input the service name in the service filter and click the ‘Apply’ button.
Download the report :
1.Scroll down to the cost and usage breakdown, then click the ‘Download as CSV’ button to download the report.


CONCLUSION:
We encourage you to delve deeper into Cost Explorer’s features and leverage its capabilities to gain a clearer understanding of your cost management. Identify the main services or resources contributing to your costs. This could include specific AWS services, regions, or usage patterns .Highlight any noticeable trends in your costs over time—whether they are increasing, decreasing, or fluctuating.

Add a Comment